EFFICIENCY AND EQUITY CONSEQUENCES OF SEPARATE INCOME TAX SYSTEMS FOR THE AUTONOMIAS IN SPAIN* by Timothy J. Goodspeed**
Documento de Trabajo 92-09
Mayo, 1992
* The author gratefully acknowledges the financial support of FEDEA and the Instituto de Estudios Fiscales in this research.
** Florida International University.
SUMMARY
Spain's federal system of government has evolved over the last decade in the wake of Franco's centralized system of government. The Autonomías, or state level governments, were formed from the Provinces during the late 1970s and early 1980s, and provide the basis for a new federal structure of government. While great strides have been made in decentralizing government, certain features of the Spanish federal system distinguish it from that of other countries such as the United States. One of these features is the current mechanism for financing the expenditures of the Autonomías. The Spanish laws, in effect, prohibit the Autonomías from using taxes. Consequently, the central government determines the budget of the Autonomías through a series of grants. This creates certain equity and efficiency consequences, which this paper investigates. The results indicate significant efficiency losses from the current system relative to separate income tax systems for the Autonomías. In addition, redistributional gains from separate income tax systems can be expected by poor Autonomías, such as Murcia, as well as rich autonomías, such as Madrid. These results suggest that measures that allow some revenue sources independent of central government control be given serious consideration as Spain's federal system of government continues to evolve.
I. INTRODUCTION
The current federal system of government in Spain has taken shape during the past decade. As summarized by Solé-Vilanova (1989), the system is characterized by 17 Autonomías, or regional level governments, which were formed in the late 1970s and early 1980s from the 50 Provinces. However, the formation of the Autonomías was not uniform. Some Autonomías are composed of a single Province, while others contain many Provinces. Perhaps more importantly, the expenditure responsibilities of the Autonomías also differ. Seven have responsibility for education and health services while the central government has responsibility for provision of these services for the other ten Autonomías.
The feature of Spain's federal system of government that this paper will focus on is the constraint on spending that results from the current mechanism of financing public services in the Autonomías. In particular, the laws of Spain currently restrict the Autonomías from using revenue sources that the federal government uses; in effect, this prohibits the use of taxes by Autonomías. Revenue for expenditures is obtained almost exclusively form grants from the federal level of government. Thus, the central government determines the size of the budget of the Autonomías. To the extent that the Autonomías would prefer to spend more or less on services than the central government allocates, an efficiency loss is generated. Moreover, the work of García-Milá and McGuire (1991) indicates that the current expenditure pattern implies a negative income elasticity of demand, which suggests that a mismatch of preferences and service levels is likely. The purpose of this paper is to compare the current financing system to a system of separate income taxes for the Autonomías, quantifying the efficiency and equity aspects of the two systems.
Previous work by Oates (1972) and Bradford and Oates (1974) lay the foundation for measuring the type of efficiency loss referred to above. The "decentralization theorem" of Oates states that provision of "local" public goods by local governments will always be at least as efficient as provision by the central government, where the central government is assumed to provide the same level of service to all. Bradford and Oates investigate the efficiency loss that would result if uniform provision of education were to replace decentralized provision for a set of communities in New Jersey; their results indicate a substantial efficiency loss. The efficiency loss from the Spanish system is conceptually similar, except that the central government is not constrained to provide the same service level to all Autonomías; what creates the efficiency loss is that the central government may provide the "wrong" service level.
Throughout this paper, migration inefficiencies are ignored. An assumption of immobility may be less troubling in Spain than in the United States, as cultural differences among regions are sometimes great enough to deter migration. However, see Goodspeed (1989) for evidence on the magnitude of migration inefficiencies from local income taxes.
The remainder of this paper is organized as follows. In the next section, current spending levels and sources of funds for the Spanish Autonomías are described. The third section discusses the theory underlying the efficiency loss, predicts the spending levels that would be achieved if the Autonomías had independent control of their budgets, and computes the change in welfare that results from decentralized spending decisions. the fourth section concludes.
II. CURRENT SPENDING LEVELS
As described by Bel i Queralt (1991), current funding for public expenditures of the Autonomías of Spain is determined primarily by the central level of government through a series of grants. These grants can be divided into three categories: unconditional grants, grants for health and education, and the interterritorial compensation fund. Health and education grants are given to Autonomías that have chosen to administer their own health and education services rather than take part in the services offered by the central level of government. The interterritorial compensation fund is a redistributive mechanism designed to transfer funds from richer to poorer Autonomías.
Table 1 shows the per-capita spending by source of funds for each Autonomía in 1989 in thousands of pesetas. While average spending over all Autonomías was 42 thousand pesetas per-capita, the variation among Autonomías is quite high. this is partly accounted for by the inclusion of health and educational grants, which comprise half of the total expenditures for Andalucía, Valencia, and Cataluña, and zero for most other Autonomías. When health and educational expenditures are removed, average expenditures are about 32 thousand pesetas per-capita, but the variance remains high.
As described by Solé-Vilanova (1989), this was an option that the Autonomía could choose at the time of its formation.
While the exchange rate has fluctuated, a conversion to dollars can be easily approximated by using an exchange rate of 100 pesetas per dollar.
Two Autonomías, Navarra and País Vasco, have a peculiar relationship with the central government, and are excluded throughout the analysis.
Per-Capita Spending by Source, 1989, thousands of pesetas Sources: Sole-Vilanova (1989) and Bel i Queralt (1991)
| Autonomía | Per-Capita Income, 1985 | Source of Funds | Total | |||
| Grants | Debt and Other Sources | |||||
| Unconditional | Health and Education | Interterritorial Compensation Fund | ||||
| Extremadura | 460 | 17.15 | 0.00 | 10.31 | 2.90 | 30.36 |
| Andalucía | 518 | 40.71 | 48.72 | 6.45 | 9.77 | 105.66 |
| Castilla-León | 529 | 10.41 | 0.00 | 5.48 | 8.95 | 24.84 |
| Murcia | 564 | 3.99 | 0.00 | 4.43 | 12.80 | 21.22 |
| Galicia | 575 | 42.49 | 1.35 | 7.08 | 9.14 | 60.05 |
| Canarias | 598 | 47.26 | 1.21 | 7.04 | 10.25 | 65.77 |
| Valencia | 667 | 25.16 | 42.68 | 3.18 | 3.80 | 74.81 |
| Castilla-La Mancha | 667 | 21.91 | 0.00 | 7.89 | 6.28 | 36.08 |
| Cantabria | 725 | 9.56 | 0.00 | 2.96 | 17.22 | 29.74 |
| Asturias | 748 | 4.14 | 0.00 | 3.77 | 5.66 | 13.57 |
| Aragón | 759 | 8.87 | 0.00 | 3.17 | 4.58 | 16.62 |
| Cataluña | 771 | 24.66 | 47.37 | 3.51 | 5.02 | 80.57 |
| Madrid | 782 | 11.45 | 0.00 | 2.29 | 11.59 | 25.33 |
| La Rioja | 874 | 11.96 | 0.00 | 2.18 | 24.66 | 38.80 |
| Baleares | 943 | 2.18 | 0.00 | 2.00 | 2.94 | 7.11 |
| Average | 679 | 18.79 | 9.42 | 4.78 | 9.04 | 42.04 |
| Standard Deviation | 134 | 14.15 | 18.46 | 2.39 | 5.72 | 27.70 |
The variation in expenditures excluding health and education results from the variation in unconditional grants. Table 1 indicates that the variation across Autonomías in funds from this source is quite marked. Average funding from this source is about 19 thousand pesetas per persona, with a standard deviation of 14 thousand pesetas. The largest recipients include Andalucía, Canarias, and Galicia; the smallest recipients of funds from this source include Murcia, Asturias, Baleares, Aragon, and Cantabria. Moreover, Table 2, which gives the proportion of spending by source of funds, indicates that a large proportion of funds comes from unconditional grants.
The interterritorial compensation fund is designed to correct for variations due to differences in income; Table 1 shows that this fund does indeed give larger amounts to poorer autonomías. However, since the variation in unconditional grants is not systematically related to income, the interterritorial compensation fund, which is relatively small in any case, does not even out expenditures across Autonomías.
Finally, Table 2 indicates that debt is a primary source of funding for some Autonomías. In particular, Murcia, Cantabria, and La Rioja all have over half of their funding from this source, with Castilla-León, Asturias, Madrid, and Baleares following closely. Further, this reliance on debt has grown in recent years and has become an increasingly severe problem for some Autonomías.
III. EFFICIENCY AND EQUITY EFFECTS OF SEPARATE INCOME TAX SYSTEMS
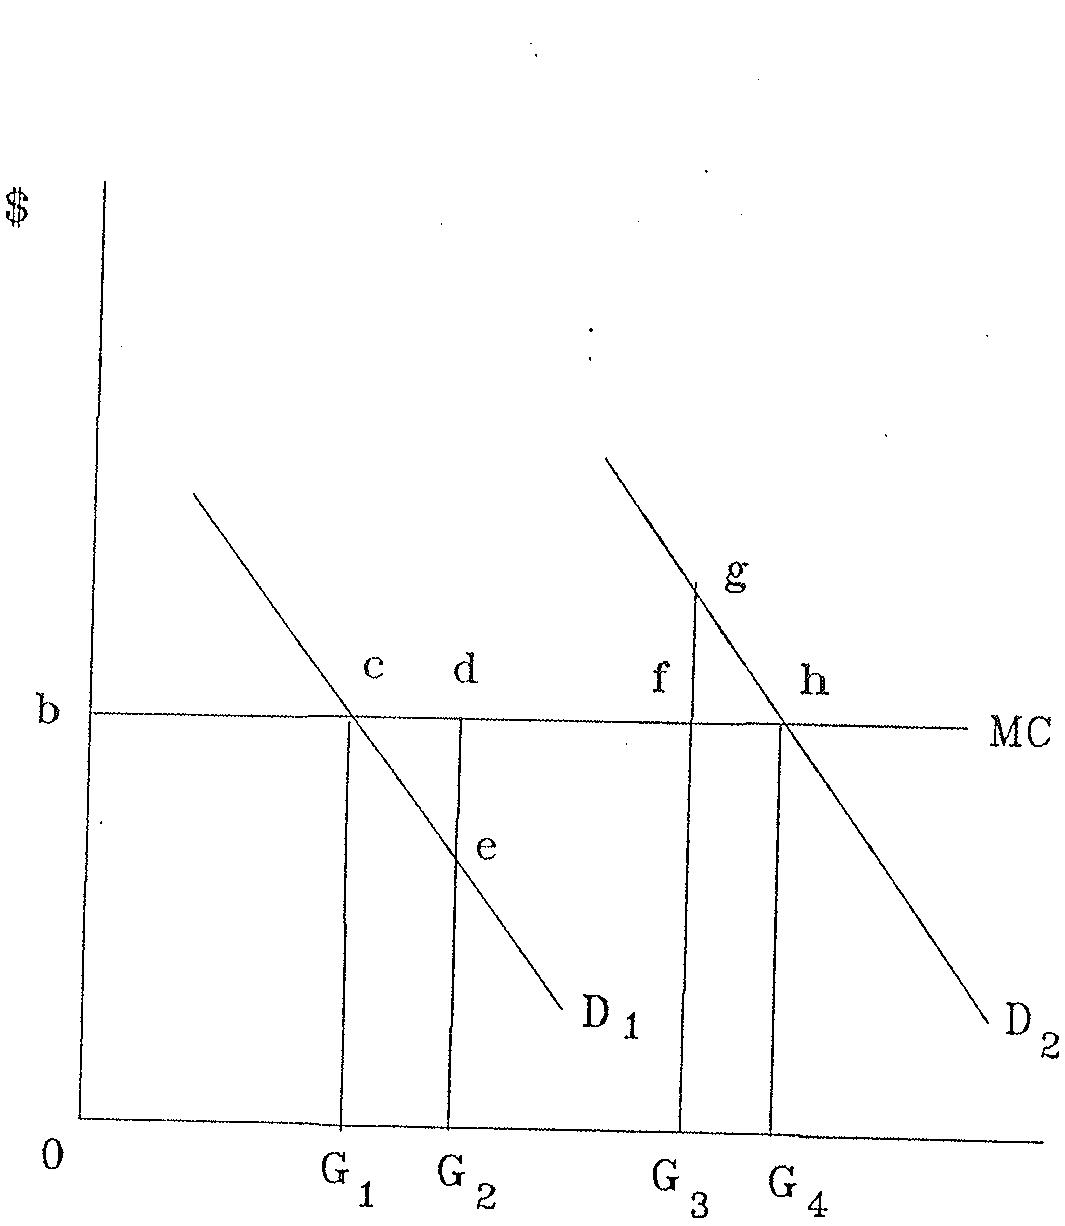
Under a decentralized system of government, the autonomías would determine their own spending levels. an efficiency loss may result if current spending levels as determined by the central government are different from those that would be chosen by the Autonomías under a decentralized system of government. to illustrate the efficiency loss, consider Figure 1, which shows the demand curves of two representative Autonomías.
Figure 1
Proportion of Total Spending by Source, 1989 Table 2
| Autonomía | Per-Capita Income, 1985 | Source of Funds | Total | |||
| Grants | Debt and Other Sources | |||||
| Unconditional | Health and Education | Interterritorial Compensation Fund | ||||
| Extremadura | 460 | 0.56 | 0.00 | 0.34 | 0.10 | 1.00 |
| Andalucía | 518 | 0.39 | 0.46 | 0.06 | 0.09 | 1.00 |
| Castilla-León | 529 | 0.42 | 0.00 | 0.22 | 0.36 | 1.00 |
| Murcia | 564 | 0.19 | 0.00 | 0.21 | 0.60 | 1.00 |
| Galicia | 575 | 0.71 | 0.02 | 0.12 | 0.15 | 1.00 |
| Canarias | 598 | 0.72 | 0.02 | 0.11 | 0.16 | 1.00 |
| Valencia | 667 | 0.34 | 0.57 | 0.04 | 0.05 | 1.00 |
| Castilla-La Mancha | 667 | 0.61 | 0.00 | 0.22 | 0.17 | 1.00 |
| Cantabria | 725 | 0.32 | 0.00 | 0.10 | 0.58 | 1.00 |
| Asturias | 748 | 0.30 | 0.00 | 0.28 | 0.42 | 1.00 |
| Aragón | 759 | 0.53 | 0.00 | 0.19 | 0.28 | 1.00 |
| Cataluña | 771 | 0.31 | 0.59 | 0.04 | 0.06 | 1.00 |
| Madrid | 782 | 0.45 | 0.00 | 0.09 | 0.46 | 1.00 |
| La Rioja | 874 | 0.31 | 0.00 | 0.06 | 0.64 | 1.00 |
| Baleares | 943 | 0.31 | 0.00 | 0.28 | 0.41 | 1.00 |
| Average | 679 | 0.43 | 0.11 | 0.16 | 0.30 | |
Suppose that the autonomías differ in income, and the lower demand curve reflects the preferences of the poorer Autonomía. Under a decentralized system of government, the poorer Autonomía would choose the level of spending . If the central government actually allocates more than , say , to be spent, the efficiency loss generated is area cde, the difference between the marginal benefit to the Autonomía of additional spending and the marginal cost. Similarly, the richer Autonomía demands a level of spending of . If the central government allocates less spending than the Autonomía would choose, say , an efficiency loss of fgh is generated.
The level of public service chosen under decentralized provision depends on the type of tax system used by the Autonomías to finance their expenditures. since the income tax has been the most discussed within Spain, this is the type of tax we assume to be used. However, given this tax system, the level of spending chosen within each autonomía may not correspond to the efficient level in the sense of satisfying the Samuelson condition. As Bergstrom (1979) has shown, a symmetric distribution of income is sufficient in a median voter model for the income tax to result in efficient spending levels. To concentrate on the efficiency loss described above, we will assume that such a distribution holds under decentralized provision.
In addition, one might question the reason for the central government's inefficient choice in the first place. One possibility is that the choice represents a redistributional trade-off such that more funds are provided to poorer communities. In this case, the efficiency loss measured below can be viewed as the price that is paid for redistributing funds between Autonomías. The following exercise then provides a means by which policy markers can be made aware of the costs involved. However, the analysis in the previous section suggests that the variation in unconditional grants has little to do with variations in income. A second possibility is that the central level of government allocates the "wrong" amount of funds, either because of the pressures of interest groups or because it does not know the demand curves of the individual Autonomías. In this case, the efficiency cost translates directly into a loss in welfare.
To measure the efficiency loss for the Spanish case, we first need to know how much the Autonomías would spend on services if they could collect their own revenue. This present quite a problem because it is impossible to estimate the Autonomías' demand for services since these services are currently funded by the federal level of government. As a base case, we will assume that the central government has chosen the correct level of spending on average. That is, the total amount spent on services will be assumed to be correct; it is only the distribution of these funds among Autonomías that creates the efficiency loss. Further, since only five Autonomías are given money for the provision of health and educational services (and only three of these are given substantial sums), a comparison across Autonomías requires some adjustment. Accordingly, we use as a base case expenditures less those allotted for health and education expenditures.
To predict expenditures under decentralized government, we need to posit a functional form for demand. We assume that the demand for services by the Autonomías can be derived from a Stone-Geary utility function; this is a simple form, but allows income elasticities to differ from one. In particular, the utility function in assumed to be of the form
\[\mathrm{U} (\mathrm{X}, \mathrm{G}) = (\mathrm{G} - \alpha_ {1}) ^ {\beta_ {1}} (\mathrm{X} - \alpha_ {2}) ^ {\beta_ {2}}\]
where X is the private good, G is the public service, and is the subsistence level of the ith good. From this utility function, we derive the demand for public services
\[\mathrm{G} = \beta_ {2} \alpha_ {1} + \beta_ {1} (\mathrm{y} - \alpha_ {2})\]
where y is income.
The parameters were set so that actual and predicted expenditures are the same on average, subsistence parameters are low enough so that all Autonomías' current expenditures meet the subsistence level, and, to the extent possible, so that demand elasticities are similar to those estimated for the United States. The parameter values used were , , , and .
Given the above assumptions, Table 3 shows the actual and predicted spending levels of the Autonomías, and the income tax rate required to finance those expenditures. The income tax rates necessary to maintain current expenditures excluding health and education range from a high of 11 percent in Andalucía and Canarias to a low of 1 percent in Baleares.
If the Autonomías were able to determine their own expenditure levels, the predictions indicate that substantial changes would occur, leading to a much more even distribution of expenditures as well as tax rates. Under a decentralized system, expenditures by andalucía, Galicia, and Canarias are expected to be halved. Conversely, expenditures by Asturias, Aragon, and Baleares can be expected to more than double. Madrid would experience an increase of 40 percent in expenditures while those by Murcia are predicted to increase by one third. While expenditure changes in the other Autonomías are predicted, the changes are not as dramatic. For instance, expenditures by Extremadura can be expected to fall by 15 percent and those of Castilla-leon to increase by 12 percent. Predicted income tax rates range from 4 to 6 percent.
The efficiency loss form restricting the revenue sources of the Autonomías can be measured by the areas indicated in Figure 1, where the demand curves are interpreted as compensated demands. More formally, we can define the compensating variation (CV) as the amount of money one would have to take away from the Autonomía after the change in order to leave it at its initial utility level. Similarly, the equivalent variation (EV) is the amount of money one would have to give the Autonomía before the change that would just allow it to achieve the level of utility it would have obtained after the change.
See Inman (1979) for a summary of studies of U.S. demand for local services. The income elasticities of demand for the predicted expenditure levels in this paper are slightly high because the subsistence parameters are restricted to be quite low due to the actual expenditures of Baleares, Asturias, and Aragon.
The subsistence parameters were based on the average per-capita income across Autonomías of 678.5. This is multiplied by .1 to obtain the subsistence parameter for X and by .01 to obtain the subsistence parameter for G.
Predicted and Actual 1989 Tax and Per-Capita Spending Levels TABLE 3
| Autonomía | Per-Capita Income, 1985 | Actual | Predictions | Predicted Minus Actual Total Spending Less Health and Education | ||||
| Per-Capita Spending Less Health and Education | Income Tax Rate Necessary to Maintain Current Total Spending | Income Tax Rate Necessary to Maintain Current Spending Less Health and Education | Per-Capita Spending Less Health and Education | Income Elasticity of Demand | Tax Rate | |||
| Extremadura | 460 | 30.36 | 0.066 | 0.066 | 23.36 | - | 0.051 | -7.01 |
| Andalucía | 518 | 56.93 | 0.204 | 0.110 | 25.83 | 0.85 | 0.050 | -31.11 |
| Castilla-Leon | 529 | 24.84 | 0.047 | 0.047 | 26.32 | 0.86 | 0.050 | 1.49 |
| Murcia | 564 | 21.22 | 0.038 | 0.038 | 27.81 | 0.86 | 0.049 | 6.59 |
| Galicia | 575 | 58.70 | 0.104 | 0.102 | 28.30 | 0.87 | 0.049 | -30.40 |
| Canarias | 598 | 64.56 | 0.110 | 0.108 | 29.29 | 0.87 | 0.049 | -35.27 |
| Valencia | 667 | 32.13 | 0.112 | 0.048 | 32.26 | 0.88 | 0.048 | 0.13 |
| Castilla-La Mancha | 667 | 36.08 | 0.054 | 0.054 | 32.26 | 0.88 | 0.048 | -3.82 |
| Cantabria | 725 | 29.74 | 0.041 | 0.041 | 34.73 | 0.89 | 0.048 | 4.99 |
| Asturias | 748 | 13.57 | 0.018 | 0.018 | 35.72 | 0.90 | 0.048 | 22.15 |
| Aragon | 759 | 16.62 | 0.022 | 0.022 | 36.21 | 0.90 | 0.048 | 19.59 |
| Cataluña | 771 | 33.19 | 0.105 | 0.043 | 36.71 | 0.90 | 0.048 | 3.51 |
| Madrid | 782 | 25.33 | 0.032 | 0.032 | 37.20 | 0.90 | 0.048 | 11.87 |
| La Rioja | 874 | 38.80 | 0.044 | 0.044 | 41.16 | 0.90 | 0.047 | 2.35 |
| Baleares | 943 | 7.11 | 0.008 | 0.008 | 44.12 | 0.91 | 0.047 | 37.01 |
| Total | 489.20 | 491.27 | ||||||
| Average | 32.61 | 0.067 | 0.052 | 32.75 | 0.88 | 0.048 | 0.14 | |
| Standard Deviation | 16.06 | 0.050 | 0.031 | 5.74 | 0.02 | 0.001 | 19.45 | |
These welfare measures can be defined implicitly from the indirect utility function, which is obtained by substituting the demand for X into the utility function. Letting a zero superscript denote actual spending, a one superscript denote the counterfactual predicted spending levels, and V(.) denote the indirect utility function, we define the CV and EV as
\[\mathrm{V} \left(\mathrm{G} ^ {0}, \mathrm{y}\right) - \mathrm{V} \left(\mathrm{G} ^ {1}, \mathrm{y} - \mathrm{CV}\right) = 0\]
\[\mathrm{V} (\mathrm{G} ^ {0}, \mathrm{y} + \mathrm{EV}) - \mathrm{V} (\mathrm{G} ^ {1}, \mathrm{y}) = 0\]
For the Stone-Geary utility function, we can simply solve for CV and EV and compute the efficiency loss.
Table 4 shows the results of this exercise for the average income individual in each Autonomía. Since the figures for Baleares are extreme, the calculations are redone without Baleares; the welfare changes when Baleares is excluded are also presented. Including Baleares, the overall welfare gain is between 45 and 56 percent of total revenue, depending on whether the CV or EV measure is used. These welfare gains drop to 12 and 15 percent, respectively, when Baleares is excluded. Even the lower figure is substantial when compared to the welfare loss form other tax distortions. for instance, as summarized by Hausman (1985), the mean labour supply distortion of the federal income tax in the United States is on the order of 20 percent of tax revenue.
These aggregate figures mask the fact that there would be substantial redistributional consequences from more decentralized government. Table 4 indicates that the biggest losers from a change to more decentralized decision making are likely to be Andalucía, Galicia and Canarias, while the biggest winners and losers are substantial. As a percent of actual spending, the welfare loss for andalucía, Galicia, and Canarias is on the order of 40 percent. The welfare gain for Asturias measures over 300 percent of current spending, while that of Aragon measures over 200 percent.
Welfare Measures Table 4
| Autonomía | Per-Capita Income, 1985 | Actual Spending Less Health and Education | Predicted Spending Less Health and Education | Compensating Variation | Equivalent Variation | CV as proportion of total spending | EV as proportion of total spending |
| Extremadura | 460 | 30.36 | 23.36 | -7.29 | -7.17 | -0.24 | -0.24 |
| Andalucía | 518 | 56.93 | 25.83 | -22.85 | -21.87 | -0.40 | -0.38 |
| Castilla-Leon | 529 | 24.84 | 26.32 | 1.86 | 1.87 | 0.08 | 0.08 |
| Murcia | 564 | 21.22 | 27.81 | 9.37 | 9.53 | 0.44 | 0.45 |
| Galicia | 575 | 58.70 | 28.30 | -23.06 | -22.17 | -0.39 | -0.38 |
| Canarias | 598 | 64.56 | 29.29 | -25.72 | -24.65 | -0.40 | -0.38 |
| Valencia | 667 | 32.13 | 32.26 | 0.15 | 0.15 | 0.00 | 0.00 |
| Castilla-La Mancha | 667 | 36.08 | 32.26 | -4.18 | -4.15 | -0.12 | -0.12 |
| Cantabria | 725 | 29.74 | 34.73 | 6.34 | 6.40 | 0.21 | 0.22 |
| Asturias | 748 | 13.57 | 35.72 | 46.93 | 50.09 | 3.46 | 3.69 |
| Aragon | 759 | 16.62 | 36.21 | 36.29 | 38.12 | 2.18 | 2.29 |
| Cataluña | 771 | 33.19 | 36.71 | 4.29 | 4.32 | 0.13 | 0.13 |
| Madrid | 782 | 25.33 | 37.20 | 17.10 | 17.49 | 0.68 | 0.69 |
| La Rioja | 874 | 38.80 | 41.16 | 2.77 | 2.78 | 0.07 | 0.07 |
| Baleares | 943 | 7.11 | 44.12 | 180.07 | 222.78 | 25.32 | 31.32 |
| Total | 489.20 | 491.27 | 222.08 | 273.50 | 0.45 | 0.56 | |
| excluding Baleares | 482.09 | 483.51 | 59.27 | 71.63 | 0.12 | 0.15 |
One interesting aspect of the redistributional consequences of more decentralized decision making is that both rich and poor Autonomías experience welfare gains. For instance, the welfare gain for relatively poor Murcia is 44 percent of current spending while that of relatively rich Madrid measures 68 percent.
IV. CONCLUSION
Spain's federal system of government has evolved over the last decade in the wake of Franco's centralized system of government. The Autonomías, or state level governments, were formed from the historic Provinces, and provided the basis for a new federal structure of government. While great strides have been made in decentralizing government, certain features of the Spanish federal system distinguish it from that of other countries such as the United States. One of these features is the current mechanism for financing the expenditures of the Autonomías. The Spanish laws, in effect, prohibit the Autonomías from using taxes. Consequently, the central government determines the budget of the Autonomías through a series of grants. This creates certain equity and efficiency consequences, which this paper investigates.
The efficiency loss from the current system relative to separate income tax systems is found to be on the order of 50 percent of total spending levels. However, a large part of this is due to a single Autonomía, Baleares; when Baleares is excluded, the welfare loss drops to about 15 percent of total spending. However, even this lower figure is substantial.
The equity consequences of independent income tax systems relative to the current financing mechanism are also striking. Andalucía, Galicia, and Canarias are expected to be much worse off and Asturias and Aragon much better off. In addition, resdistributional gains from separate income tax systems can be expected by poor Autonomías, such as Murcia, as well as rich Autonomías, such as Madrid. These results suggest that measures that allow some revenue sources independent of central government control be given serious consideration as Spain's federal system government continues to evolve.
BIBLIOGRAPHY
Bel i Queralt, Germa. 1991. "La financiación de las Comunidades Autónomas." FEDEA Cuadernos de Economía y Finanzas 4. Madrid, Spain.
Bergstrom, Theodore. 1979. "When Does Majority Rule Supply Public Goods Efficiently?" Scandinavian Journal of Economics, 81, 216-226.
Bradford, David, and Wallace Oates. 1974. "Suburban Exploitation of Central Cities and Governmental Structure," in H. Hochman and G. Peterson, eds., Redistribution through Public Choice. New York: Columbia University Press.
García-Milá, Teresa and Therese McGuire. 1991. "The Effects of Central
ed., Public Finance with Several Levels of Government.
Goodspeed, Timothy J. 1989. "A Re-Examination of the Use of Ability to Pay Taxes by Local Governments." Journal of Public Economics. 38: 319-342.
Inman, Robert P. 1979. "The Fiscal Performance of Local Governments: An Interpretive Review," in P. Mieszkowski and M. Straszheim, eds., Current Issues in Urban Economics. Baltimore: The Johns Hopkins Press.
Hausman, Jerry A. 1985. "Taxes and Labor Supply," in A.Auerbach and M.Feldstein, eds., Handbook of Public Economics, Volume 1. Amsterdam: North-Holland.
Oates, Wallace. 1972. Fiscal Federalism. New York: Harcourt Brace Jovanovich.
Solé-Vilanova, Joaquim. 1989. "Spain: Developments in Regional and Local Government," in R. Bennett, ed., Territory and Administration in Europe. London: Pinter Publishers.
Este texto se ha extraído automáticamente del documento original. Para citarlo o leerlo con su maquetación, descargue el PDF.
Descargar en PDF