JORGE JUAN, 46 28001 MADRID ADMINISTRACION Y DOCUMENTACION TEL.: 435 90 20 INVESTIGACION TEL.: 435 04 01 TELS.: 435 04 01/91 FAX: 577 95 75
Profitability of the different services of RENFE by John Dodgson* and Pablo Rodriguez Alvarez**
Diciembre 1994
* University of Liverpool, England
** Universidad Carlos III de Madrid
ACKNOWLEDGEMENTS
This Report is one of two which forms the research project on "Economic Aspects of Spanish Railways". The other report is by John Dodgson and Mar González Savignat, and is titled "A Cost-Benefit Analysis Framework for Spanish Railway Services".
The project was funded by the Banco de España and FEDEA. We are extremely grateful to these organisations for their financial assistance, though we alone are responsible for the contents of this report.
We should like to thank Jose A. Herce of FEDEA for facilitating the study. From RENFE, we particularly wish to thank Jesús Crespo and especially Rafael Almodovar for all the information and assistance they provided for the study. Finally, we thank Paul Day for his research assistance at the University of Liverpool.
CONTENTS
Introduction
1. RENFE: traffic and revenue trends
II. Railway policy in Spain
III. The Spanish approach and European Union railway policy
IV. Trends in profitability, and accounting results under RENFE's new organisational structure
V. Theory and practice of transfer prices
VI. The joint cost question
VII. Infrastructure cost allocation exercises
VIII. Conclusions
References
Appendix: Figures and Tables
Introduction
This study is concerned with the financial situation of the Spanish national railway system RENFE (Red Nacional de Ferrocarriles Espanoles). In particular, it considers the profitability of the different business units created when the Company was reorganised. There are major problems involved in determining the profitability of internal business units, since this profitability will be partly dependent on the system of transfer prices used to value internal transactions within the organisation. In addition, there is the question of the appropriate treatment of joint costs, and particularly railway infrastructure costs, which reflect the costs of facilities shared by different business units.
This report proceeds by first reviewing trends in traffic and revenue on RENFE. We pay particular attention both to the changes in traffic volumes, and to the trends in real, inflation-adjusted, passenger fares and freight charges. We next outline the organisational changes in RENFE, and the creation of the new business units. This is followed by a review of the European Union's railway policy, and its relationship to the Spanish reorganisation. After briefly summarizing profitability trends, Section IV presents the set of accounts for RENFE for 1992 to show the inter-relationships between the different types of business units, and the structure of the overall financial losses incurred. As noted above, these financial results will depend on the transfer prices used, so Section V of the Report describes the logic and practice of the transfer price systems used by RENFE. Infrastructure costs are not allocated to business units, but Section VI shows the different methods by which railway track and signalling costs might be allocated to different types of business. Section VII then illustrates two alternative cost allocation methods: these allocation exercises are limited by the data we have available. The final section of the Report presents our conclusions, particularly with regard to the desirability of allocating infrastructure costs to business units.
Of course, railways should not be judged by profitability alone, and there are good social reasons for subsidising rail services. This does not mean that all subsidies are automatically justified, and the appropriate way to judge railway subsidies is to use social cost-benefit analysis to try to value the social benefits of RENFE which are not captured in railway revenue. These benefits can then be compared with the financial losses that need to be covered by Government subsidy. The second report in this study (John Dodgson and Mar Gonzalez Savignat "A Cost-Benefit Analysis Framework for Spanish Railway Services") outlines the cost-benefit analysis framework, discusses the relevant measurement and valuation issues, presents information on current valuations of social benefits of railways in Spain, and considers the relative importance of the different types of social benefit for RENFE's different business sectors.
I. RENFE: traffic and revenue trends
This Section of the report considers traffic and revenue trends in RENFE's different business units (Unidades de Negocios) as they are now defined. This section also considers the present structure of the railway network in Spain.
Traffic and market shares
Table 1 (see the Appendix) shows data on overall traffic levels and market share on the different transport modes in Spain for both passenger traffic (in passenger-kms) and freight traffic (in tonne-kms) from 1960 to 1991. In 1991 railways had a 7 per cent share of passenger traffic, whereas road had a 90 per cent share. As Figure 1 shows, rail had a 30 per cent share in 1960 and road a 67 per cent share. Although rail's share has declined, Figure 2 shows that total rail passenger traffic has nevertheless increased over this thirty year period.
On the freight side, rail had a 5 per cent share of the domestic Spanish freight market in 1991, whereas road freight had a 75 per cent share, sea transport a 17 per cent share, and pipelines 2 per cent. Figure 3 shows the trends in market shares, with rail having a 20 per cent share of the market in 1960, road 42 per cent, and shipping 39 per cent. As Figure 4 shows, total tonne-km hauled by rail in Spain have declined since 1988.
RENFE'S business units and their traffic characteristics are as follows:
Cercantías. These are the commuter services that operate in twelve cities. Table 6 (Appendix) shows the traffic in different cities in 1990, 1991 and 1992. In 1992 54 per cent of commuter passengers were in Madrid, 23 per cent in Barcelona, and 8 per cent in Bilbao . In 1992 this business sector carried 36 per cent of total passenger-km and about 89 per cent of RENFE's total passengers. The sector has seen rapid growth in traffic in recent years with the development of rail commuter services. These have an important role in reducing traffic congestion in the larger cities in Spain.
There have been several changes in the calculation methods. Before 1979 a global figure of traffic was obtained from the revenue data. In that year a new method was adopted, based on continuous surveys on certain routes and on a global survey in a representative week.
Before 1991 the traffic of Regional and Commuter services was not well known because the fact that Regional's trains carry Commuter's passengers was not properly accounted for. This means that the first reliable data about the two sectors separately were obtained in 1991. In this year, with the spread of the VISIR (Integrated selling of tickets without booking in advance) for the sale of both sectors' tickets, a new method of traffic assessment was adopted. According to this method, the 1991 traffic is 1900 million passenger-kms and 21.1 million journeys.
Regionales. These consist of services that connect capitals or relevant cities of less than 500 kms of distance, and those routes that the Largo Recorrido services do not serve. The proportion of Regionales in total traffic is diminishing, because it operates in low density flows. Nevertheless in the last years some new products have been introduced in markets with a considerable demand (Catalunya Express, and Regional Express).
Largo Recorrido. These services include long distance services on radial corridors from Madrid to different regions of Spain; some transversal corridors; and also international traffic. The number of passenger-kilometres has fallen, following a trend that was reversed for a period between 1982 and 1985. The loss of traffic is mainly due to the impact of the construction of new motorways and the competition from regular road coach services. Within this sector there has been some reallocation of service, concentrating the efforts on the higher quality services (Talgo, first class...) that are most in demand, and on the routes where the railways were more competitive. Tables 7 and 8 (Appendix) show breakdowns of long distance traffic between different corridors and different types of train.
AVE (Spanish High Speed). These services started operating in April 1992 on the new standard gauge route between Madrid and Sevilla. This sector can be considered in isolation because of its particular technical characteristics. The main services are between Madrid and Sevilla. Shuttle trains also operate between Puertollano and Ciudad Real, and the route also has some Talgo trains. Demand has grown considerably in 1993.
Cargas Completas. This freight sector includes full-load wagons (on trains carrying wagons for different clients), full-load trains (trains for a single client) and internal transport. Apart from the impact of road competition, this UNe has faced a decrease in its market because the traditional clients of Renfe have been losing importance in the economy in terms of their contribution to GNP as sectors like coal, minerals, cement and oil which move flows of bulk traffic have been reorganised. In addition, oil traffic has been lost to pipelines.
Transporte Combinado. This freight sector hauls conventional containers, and also express trains (TECO) with lower movement needs. The sector has achieved a share of 24 per cent of total rail traffic, though in the last few years its traffic has fallen. This market, together with long distance bulk traffic and urgent parcels is one of the more promising in the freight business, because of the support of the European Commission for intermodal transport.
Paquetería. This sector consists of three main products. Paquexpress deals with urgent delivery parcels, operating mainly with passenger trains, especially overnight ones. Cargoexpress transports less urgent parcels, of bigger size, on long distance trains (CEX). Both sectors have a network for distributing and concentrating parcels with some road transport. In 1992 Renfe lost its monopoly of providing mail services, and since then Correos traffic has decreased considerably.
Detailed traffic trends for all the above sectors are shown in Tables 2, 3, 4 and 5 in the Appendix. Table 2 shows passenger journeys and freight tonnes, and so does not allow for differences in journey length or length of haul. Table 3 gives a breakdown of the full load tonnage by commodity group. Table 4 shows the breakdown of traffic in passenger-kms or tonne-kms, while Table 5 gives the commodity breakdown of full-load freight.
Revenue and revenue per traffic unit
We next consider revenue earned from all of the above traffics. The most relevant here is revenue corrected for changes in the general price level in Spain. The index which we use to correct current revenue figures to revenue at 1992 prices is the retail price index.
Table 9 in the Appendix shows revenue from the different types of business at current prices, and Table 10 shows these total revenues converted to 1992 prices. Table 10 shows that real revenue from passenger services has been increasing since 1989, whereas real revenue from freight services has been declining since 1981, the last year for which we have full figures.
Table 11 in the Appendix shows unit prices in terms of real revenue per traffic unit (passenger-kms or tonne-kms). In 1992 the passenger business earned an average of 5.75 pts per passenger-km. The high-quality AVE services earned 16.45 pts per passenger-km. Largo Recorrido earned 6.91 pts per passenger-km. Revenue per passenger-km was lower for the Cercanias (3.79 pts) and Regionales (4.32 pts) services. Over the passenger business as a whole, the Table shows that real revenue per passenger-km has remained fairly stable, at between 5 and 6 pesetas per passenger-km at 1992 prices.
Table 11 also shows the decline in real revenue per freight tonne-km, from 9.07 pts in 1981 to 5.70 pts by 1992. The Table shows how the high value Paqueteria services earn much higher revenue per tonne-km than the other freight businesses (though these higher revenues do not necessarily compensate for the much higher handling costs). The trends in this Table are summarised in Figure 6, which shows trends in real revenue per tonne-km in the three main freight sectors between 1981 and 1992.
There are a number of reasons why unit revenue in the freight sector may have declined:
(1) if length of haul has grown, then the proportion of terminal and marshalling cost will be a lower proportion of total costs, and so that could explain the reduction in the rates per tonne-km. Tables 12 and 13 in the Appendix show average length of haul for different types of traffic. The information on freight is summarised in Figure 7, which shows some increase in average length of haul for the average freight business.
(2) if the composition of traffic changes towards bulk traffic, rather than wagon load and container traffic, less movement costs are caused and consequently lower rates per tonne-km would also be justified. However, some of the most important bulk products (coal, solid fuels, petroleum, ores, metal, building material) have declined, while some traditionally wagon-load traffic such as timber, cereals and iron/steel products have grown.
(3) if freight rates are set on the basis of the value of the traffic carried (i.e. on the principle of "what the market will bear"), we can observe if products with a higher value have decreased in volume. This is the case for domestic automobile traffic, liquid fuels and military haulage. On the other hand, medium value products such as timber, cement and minerals have increased.
(4) if the load factor has risen then it also justifies lower rates. Average load factor is equal to tonne-kms divided by train-kms. Figure 8 shows average freight train load factor. This figure clearly shows a fall in average freight train load factors in Spain.
It appears unlikely that the above factors can account for all the changes in real rail freight changes in Spain, and so we conclude that the failure of these changes to keep pace with inflation cannot be easily explained in terms of reductions in the real costs of handling the traffics carried.
The railway network
In 1991 RENFE operated a network of 12,570 kilometres of railway route. The Table below shows the characteristics of this network. Twenty two per cent of the network was double-track, and the remaining 78 per cent single track, with the capacity problems that involves. Just over half of the network (51 per cent) was electrified, including almost all the double-track route.
The network is divided into four categories of route, A1, A2, B and C, depending on the density of traffic that each bears. Those that bear a high density of traffic are provided with better facilities in terms of signalling, quality of track, electrification etc. The other categories, B and C, are only maintained at low or minimum standards of quality.
| non electr | electrified | TOTAL NETWORK | ||||||
| single | total | single | total | KMS. | %single | %elect | with AB | |
| 1970 | 9981 | 10572 | 1684 | 3096 | 13668 | 85,3 | 22,7 | 2119 |
| 1975 | 9328 | 9832 | 2088 | 3665 | 13497 | 84,6 | 27,2 | 3121 |
| 1980 | 8016 | 8069 | 3255 | 3473 | 11542 | 97,7 | 30,1 | 3996 |
| 1985 | 6499 | 6510 | 3682 | 6200 | 12710 | 80,1 | 48,8 | 4147 |
| 1986 | 6492 | 6513 | 3652 | 6208 | 12721 | 79,7 | 48,8 | 4329 |
| 1987 | 6366 | 6386 | 3717 | 6300 | 12686 | 79,5 | 49,7 | 4347 |
| 1988 | 6215 | 6235 | 3723 | 6315 | 12550 | 79,2 | 50,3 | 4396 |
| 1989 | 6123 | 6143 | 3811 | 6422 | 12565 | 79,1 | 51,1 | 4473 |
| 1990 | 6051 | 6144 | 3805 | 6416 | 12560 | 78,5 | 51,1 | 4517 |
| 1991 | 6051 | 6144 | 3805 | 6426 | 12570 | 78,4 | 51,1 | 4539 |
The map in the appendix (Average of daily circulation/Promedio diario de circulaciones par lineas) shows the density of traffic on different sections of route, and the use of the network by passenger and freight trains.
The structure of railway costs
An important question in analysing railway policy is that of the way railway costs very with the size of the firm, the structure of the network, and the composition of traffics handled. Provided sufficient data are available, this can be considered using econometric estimation techniques. European railway costs have been studied by the Institute for Transport Studies at the University of Leeds, and a companion study to the present one (Anibarro Garcia, 1993) has extended this analysis to include RENFE. This analysis uses the translog cost model to analyse railway costs, using annual data on 15 national railway companies for the years from 1971 to 1990 (see also Preston, 1994).
The results show that with regard to the effects of the size of firm there are increasing returns to scale for the smaller firms, constant returns to scale for medium sized firms, and decreasing returns to scale for the larger firms. The RTS measure for RENFE is around 0.7, indicating decreasing returns to scale. In turn, this implies that the size of RENFE was too large, though the switch to business units after 1990 might yield the type of cost-reduction benefits necessary to offset these apparent diseconomies of scale revealed from the RENFE data for the 1971 to 1990 period. Most railways show evidence of increasing returns to density, indicating that costs could be reduced by concentrating traffic on fewer routes. RENFE is no exception, although there is a steady reduction in returns to density over the sample period. The evidence of returns to density indicates that costs could be reduced by abandoning lower density lines and (where geographically possible) concentrating traffic on fewer routes. Given that 78 per cent of RENFE's network was already single-track in 1991, the scope for reducing costs by reducing track capacity on individual routes is likely to be limited.
II. Railway policy in Spain.
In this section we consider railway policy in Spain, and how it influences the performance and profitability of RENFE. In 1987 the Law for the Ordination of Surface Transport was approved, to regulate both road and rail transport. This law determines that services should be provided in the framework of a free market, with the role of regulation being to ensure competition between operators and modes. In the case of Railways the planning and authorisation of the services will be decided by the State, while the operators will be responsible for the operation of the lines and services. RENFE's role will be to run the lines and services of the Integrated National Network which will be defined by the State (Pérez 1992: 30).
The Railways Transport Plan (PTF) was also approved in 1987. This plan has the aim of promoting the railway selectively, defining the general principles of the policy until the year 2000, and providing the specific objectives of the infrastructure investment, the pattern of services and pricing policy. These objectives are as follows:
- the network and the services will be adapted to the demand needs, introducing new technology to provide a competitive service for the appropriate traffics.
• economic factors must guide planning and management, trying to restrain expenditure and to allocate resources efficiently.
• railways will compete with other modes and should cover their costs with revenue (or with government compensations in the case of social services).
• planning will follow:
- PTF: the strategic plan to the year 2000.
- Multiannual plans in the medium term: these are the Contrato Programa
- Business plans which set the annual objectives for management from the economic and technical viewpoints.
The last Contrato Programa was from 1988-91, and is still in existence until the new one is approved. In this contract RENFE is committed to achieve the following objectives:
- carry a specific number of passenger and tonne-kms, with an increase in each year.
- supply the services with specified levels of quality.
- improve the economic results, according to specific targets.
- undertake the investments planned: for operations and management rationalisation improving safety.
develop a new system of tariffs and pricing, trying to ensure that higher quality services cover their costs.
- rationalise the decision process.
The government's commitments concerned the investment programme, the payment of the railway's debts before 1988, and the payment of subsidies and compensations. As Carbajo et al. (1989:213) show, in these guidelines there is no explicit remit to RENFE for pricing and investment policies, for instance which costs should be covered, and how to finance the other costs. It was necessary to wait until 1991 to obtain the answers to such questions with the implementation of the new structure of RENFE.
RENFE's new organisational structure
In 1991 RENFE adopted a new model of organisation. The Company is organised into twelve Business Units (UNes), classified as follows:
Transport Operators Passenger AVE Largo Recorrido Cercanias Regionales Freight Cargas Completas Transporte Combinado Paqueteria
Providers of Services Stations and Joint Services Rolling Stock Maintenance Traction
Infrastructure Management Infrastructure Maintenance Traffic Movement (Circulation)
This new model replaces the old one which was based on geographical areas and functional departments (production, maintenance and purchases, engineering, quality, commercial management...). Some of these departments continue operating and others have been restructured and converted into business units.
The first objective of this new model is to specialise in the different markets that RENFE operates which may be profitable or potentially profitable in social and/or in financial terms. The second objective is to obtain control over the costs.
Each business unit will be responsible for the consequences on revenues and costs of the different strategies adopted. The performance of each unit is to be judged against its Account of Results. They will consist of three categories:
(1) The unit's own revenues and costs
(2) Revenues earned from other business units, and the costs of services supplied by other business units. Calculation of these requires conventions on the valuation of the products or services that each business unit provides within the overall railway organisation ie a set of "transfer prices".
(3) Depreciation charges on capital assets.
Consequently these accounts are intended to control the management of the different business units and also to act as a planning tool in the medium term. This is because they provide signals about the managers' successes in the achievement of their targets.
RENFE has decided that the business unit's accounts should include neither the interest payments for financing the deficits not covered by the state nor those derived from the investment plans which RENFE thinks should have been undertaken by the state.
In its Business Plan for 1992-93 RENFE set some strategies consistent with the study of its possibilities for operating in different markets. In the 1993 Budget the translation of such strategies in terms of economic objectives in the short term can be seen. They broadly consist of improving the margin between revenue and costs in the different business units. Each business unit also identifies the surplus capacity that should be removed. These objectives are consistent with the medium term objectives of obtaining a positive Contribution Balance in five years for Largo Recorrido, Cargas Completas and Transporte Combinado, and in three years for Paquetería, and maintaining a fixed unit cost per passenger in Regionales and Cercanias.
III. The Spanish approach and European Union railway policy
We now consider if this organisational model and the Spanish approach to railway policy are consistent with the kind of recommendations that come from the European Commission's railways policy (Directive of the Council, 29th July 1991, 440/91 on the Development of the Community Railways). These recommendations try to deal with the problems of the financial debts of the firms and the inadequacy of the railway infrastructure (Nash, 1992). They can be summarised as having the following objectives:
1. To create a framework that allows autonomy in the management of the railways.
2. To set contractual devices to provide transport services of social value (commuter and regional) between the government and the railways so as to guarantee economic viability of the railway organisation.
3. To improve the finances of the firms in dealing with the payments of historical debt charges.
4. To clarify the functions and costs associated with infrastructure management and transport operations.
5. To liberalise access to the infrastructure with user charges for access to the network.
We will analyse these objectives and issues in turn:
1. Autonomy in the management of the railways
The regulation of railways has been maintained largely by the belief that railways are a natural monopoly. This condition meant that the states tried to control fares and charges in order to restrict the possibilities of railways exploiting monopoly power, and to impose the obligation to accept whatever traffics were offered to them at these fares. The latter obligations are referred to as "common carrier" obligations. In most cases the railways were largely protected from outside competition in order to exploit their economies. Nevertheless traffic shares have declined even in the markets in which rail was better suited, and deficits have grown. The solution to the railway crisis comes through defining its role, in terms of the routes to serve, the levels of service to offer and the prices charged for them. These solutions seek to deal with the problems of services with low demand, and others where costs exceed the price which rail users are prepared to pay.
In this context a closer relation between the managers and the results, so that managers have more responsibility and more autonomy, is needed. The first step towards this objective of autonomy was the split of RENFE into sectors, with separate responsibility for the different managers. Each sector manager has different objectives to the others, depending on the financial profitability of their sector and their efficiency in the use of resources.
The solution given to passenger and freight services is to separate out those that operate in competition with other modes, and should not receive any subsidy (AVE, Long Distance and Freight) from those that could not survive without subsidy but are required for social reasons because they provide an alternative transport service (Regional and Commuter). The problem with passenger services is that the separation between social and commercial services is not clear (Nash 1985: 114) because it is usual for the business units to operate on the same route and to share costs and revenue. For instance Largo Recorrido and Regionales have overlapping services, and the Largo Recorrido sector has to cover all its operating costs while Regionales does not. The existence of joint costs and revenues makes the profitability of the different services difficult to define because the allocation of revenue and particularly costs will depend on more or less rational conventions.
On the other hand RENFE does not have complete autonomy to decide on the routes to serve, the levels of service to offer, and the prices to charge. It is constrained because it has no choice regarding on the size of the network, it is not free to make major service rationalisations, and the fares for social services have to be approved by the government . These restrictions should mainly affect the social services, and not those which have to compete more directly in the market.
At the beginning of 1993 a plan to reorganise the passenger sector was presented. It broadly consisted in reducing long distance services by 5.8 per cent and regional services by 4 per cent. This objective would be achieved by combining some parallel services, or withdrawing them on certain days of the week. The plan that was initially devised has been modified, due to withdrawing agreements with regional authorities and the Ministry. At the same time the Largo Recorrido sector is introducing some improvements in its train fleets to reduce the travel time to be competitive with road in terms of price and quality.
Article 252.2 of the Reglamento 1211/90, 28th. Sept. 1990, on the development of the LOTT (Surface Transport Ordination Law) says that when RENFE proposes to close any line or service or to modify any other basic conditions of operations (that is the closure or change in the use of stations; the withdrawal of more than 25 per cent of the services in any line/section of lines or any other action that affects the users), it will ask for the Ministry of Transport's authorization, which will be decided after taking into account the report of the Communidades Autónomas affected.
Since 1993 RENFE has been free to set fares on intercity services and rates for freight, while the increases in commuter and regional fares continue to be under government authorisation. Nevertheless Cercanías can charge a supplement at weekends. The Largo Recorrido sector is introducing a differential fare system by trains, depending on the demand in each corridor. The structure will be similar to the AVE's system, with different prices for peak and off peak periods.
The freight business has introduced some measures to reduce costs and to abandon some traffics. The most significant are that the minimum size of haul is now greater; the number of operating terminals for combined transport has decreased; the rates for wagonload traffic have been increased; and delivery times have been improved. One objective is to change this traffic (especially timber, cereals and iron/steel) into full train-load traffic .
2. Contractual devices to finance social services
We have seen above that RENFE faces restraints on its performance due to the imposition of certain obligations by government. In the Contrato Programa (point 5.2) the payment for the compensation of the Public Service Obligation (PSO) is set. It includes the following categories:
• Services on lines and branches with low traffic levels which are supplied because of regional or national interests.
• Regionales and Cercanías services: these sectors are compensated by the obligation of carrying passengers as was defined in 1191/69 EEC. This compensation covers the difference between the fare income from these services and the costs, estimated in advance.
- Maintenance, vigilance and depreciation of infrastructure: they are paid in accordance with article 3.1.b of 1107/70 EC. The justification of this subsidy is that the road hauliers do not pay the infrastructure costs they cause and so RENFE should be treated in the same way, until the appropriate road charges were set. This subsidy is also established in advance, though in 1992 it was modified to include the costs of the AVE.
• Normalisation of accounts: this includes some social security obligations of RENFE which are not borne by other modes (1192/69 EC).
The importance of wagon-load trains on the profitability of the Cargas Completas business unit may be clearer with these figures: in 1992 this type of train represented 6 per cent of income, 20 per cent of costs and 80 per cent of losses of the business unit. The total losses of the business unit were 7934 million ptas, and 6392 million ptas of these were caused by wagon-load trains. (Lineas de Gestion n° 62, 19th May 1993, page 7).
We have to consider whether this method of payment gives an incentive for the efficient use of resources, and also if it provides a good way of monitoring managers' performance. Following Nash (1985: 113), these two objectives require different information to be used:
• to know the purpose of the subsidy requires detailed information about the receipts and expenses of each service/or group of services.
• to use the subsidies efficiency needs to be judged according to the achievement of clear objectives. This control has to be done in an aggregate level because the existence of joint costs means that the allocation of these costs is meaningful only at a certain level of aggregation of services.
There is another desirable condition which should hold: transparency in the subsidies' administration, which means that it should be possible to know the consequences of different levels of subsidy or different allocations between services.
First of all, the payments are agreed in advance, and so there is an incentive to be efficient, that is to obtain the objectives with the available resources. The key question is how to define such objectives for traffic and subsidy levels. The solution that Nash proposes would be to undertake a cost benefit analysis for regional and commuter services in order to set the level of subsidy, and then give managers the objective of maximising the number of passenger-km as the rule for day-to-day management. It has been demonstrated that this is a good approximation to the efficient economic objective of maximising social welfare, and it also gives the managers a clear rule to follow.
In the case of Cercanías, the business unit receives an additional incentive of 3 pesetas per extra passenger-km carried over the target. Consequently this sector has an incentive to maximise the number of passenger-kms. For Regional there is no such incentive, and so its objective is less clear. The cause may be the existence of services that carry large flows of traffic and so could be social or commercially profitable, and other ones that should be withdrawn according to cost-benefit criteria . There is then a clear cross-subsidisation between services, with a loss of welfare that can only be justified on political grounds. Most of the regions with unprofitable services both historically and currently have poor communications, and there is then strong opposition to reduction in their low levels of services even though the substitution of buses could be a more efficient and cheaper mode of transport.
There are some Regionales services that show a very poor financial performance. In the review Lineas de Gestión, no. 56, pages 6 and following, some examples of this fact are presented. For instance:
- the service A Coruña-Lugo-Ourense earned, from January to August of 1992, 21.5 million ptas of revenue and incurred 251 m.ptas of costs (a revenue-cost ratio of only 8 per cent)
- Ourense-Zamora-Medina: 24 and 233.9 (10.2 per cent).
- Gijón-León: 54.3 and 246 (22 per cent)
- Vigo-Ourense-Ponferrada-Leon, 90.7 and 335.9 (27 per cent).
These poor results may be slightly improved if we add the contributory revenue to the other services of RENFE.
RENFE's first intention was to reduce some regional services in cases where they carried less than 50 passengers per day (that is the traffic could be carried by one bus). The possibility of substituting rail services by bus services is also being considered. There are also changes in fares trying to reduce the differences between the reduced and the normal fare.
A more disaggregated subsidy, by groups of services, may give a better understanding about the value obtained from subsidy, and also should imply a lower amount of subsidy if the non-profitable services in social terms are withdrawn. One possibility would be for the regional institutions to finance the services. The payment should be based on the avoidable cost, that is the cost that could be saved if the service no longer exists.
The method of administering the grant is not transparent because there is no clear guidance as to what the social priorities should be, and which benefits could be gained by different combinations of fares and quality, and different allocations of subsidy between regions.
Finally, referring to the infrastructure subsidies, there is no way of knowing if they are justified in terms of economic efficiency or it they are merely a way of making up deficits, because there is no intention of allocating the infrastructure costs to the sectors. Therefore this grant does not pass the transparency test because we do not know how the figures are derived, and how the infrastructure business unit is going to control its costs, and whether it has incentives to reduce them.
3. Improve the finances of the firms, dealing with the payments of historical debts
There are two types of subsidies to RENFE to allow for the interest generated from the loans to finance: (a) the deficits not paid by the government, which are classified under the heading "State Account" and (b) the investments made by RENFE that should have been undertaken by the state.
These two items have grown considerably in the last two years, and this is also the case for depreciation (see page 21). Therefore this is an important constraint on the autonomy of RENFE to add to those mentioned above.
Apart from these two specific subsidies, the rise in interest and depreciation charges is also taken into account in the Contrato Programa. The Operating Results targets from 1988 to 1991 were adjusted to take account of this .
In point 18.2 of the Contrato-Programa the way to modify the results before depreciation and interest, and the Operating Results is established:
4. Clarify the functions and costs associated with infrastructure management and transport operations
The EC argued that there were three reasons to separate infrastructure and operations:
(1) so that railways would be in a similar position to roads;
(2) to permit the introduction of competition in the operation of services (the contestability argument)
(3) to facilitate the operation of international services by single operators.
The similarity with roads argument means that the state should provide the infrastructure for both modes and charge for its use. The provision of infrastructure on the two modes should be undertaken according to the same criteria, the most appropriate of which would be social cost-benefit analysis. Services should pay prices based on the marginal social costs they impose, though problems arise (as we shall see in Section VII below) in apportioning joint costs of infrastructure among services.
An important issue is how far the actual management of infrastructure and operations (as opposed to their financial accounts) should be separated. RENFE has been retained as a vertical organisation, whereas in the U.K. infrastructure and operations will soon become the responsibility of separate companies. Given the close relationship between investment in rolling stock and infrastructure, this might create problems in co-ordinating future rail investments in Britain.
The contestability argument is based on the assumption that operation of train services can be a contestable market. If a market is perfectly contestable individual operators have to charge prices equal to marginal costs because of the threat of entry of new operators if the incumbents' prices exceed marginal costs. As long as the industry is not a natural monopoly, prices will also be equal to average costs. One of the necessary conditions for a contestable market is the absence of sunk costs. This is certainly not true of railway infrastructure, hence the argument for separating out the allegedly-contestable component (operations) from the clearly not contestable one (infrastructure). However, attempts in Great Britain to devise a contestable market for railway operations have not yet proved successful.
The third reason for separating infrastructure and operations is the argument that separate management would facilitate the development of specialised operators providing international rail services in a more efficient way. This assumption is also based on fair access charges which allow new entrants to compete freely. In order to take advantage of economies of density it could be worthwhile to concentrate the flows on a few routes, and the current tendency is the creation of some joint ventures between different firms.
(1) the results before depreciation and interests will be adjusted in line with the retail price index.
(2) the subsidised depreciation will be the lesser of the following two figures:
(a) that actually produced
(b) that projected for that year, plus an increase of 10 per cent.
(3) the financial expenses will be the result of the sum of types of financial debts, actualised according to changes in interest rates.
Now that we have considered the different arguments in favour of separation of infrastructure and operations, an important question arises: Does this model permit a better control over the infrastructure costs and quality than the existing one? The Infrastructure Management of RENFE is responsible for the functions of providing, maintaining and operating the infrastructure. The objective of this organisation is to optimise the resources in accordance with the economic and technical needs of the operators. The economic aspect may be guaranteed by a fair treatment in the allocation of capacity. The technical aspect means that there will be a need to provide good quality infrastructure, in terms of track quality, punctuality, safety, etc. As noted above, the infrastructure organisation will also have to be coordinated with the operators in order to make the appropriate investment to take advantage of investment in rolling stock assets.
5. Liberalise access to the infrastructure with access charges for use
These payments should be based on some measure of cost causation, such as train-kms, speed, time, axle weights, which attempt to charge the marginal social costs for the use of the track and other facilities. In practice this is extremely complicated in a system where a mix of different traffics operates, and even more difficult where there are different companies operating. Section VII considers the problems involved in assessing optimal infrastructure charges for rail services.
IV. Trends in profitability, and accounting results under renfe's new organisational structure
In this Section of the report we first review the trends in financial performance for RENFE over the period from 1984 to 1992. We next present the set of RENFE's results for 1992 under the accounting conventions used with the new business sector organisation. This shows how the business results for each sector are devised. It also shows overall make-up of the various forms of subsidy provided by the Government to RENFE.
Financial performance from 1984 to 1992
The Table on the next page shows financial trends over the period from 1984 to 1992. The trends in traffic and prices underlying the revenue trends were discussed in Section I of this report. A major feature is the increasing importance of passenger revenue in relation to freight revenue as a proportion of total revenue. On the cost side, staff costs have declined in real terms but have remained a constant proportion of total costs despite a substantial reduction in the total number of employees.
OPERATING RESULTS AT CURRENT AND 1992 PRICES. (million ptas)
| 1984 | 1985 | 1986 | 1987 | 1988 | 1989 | 1990 | 1991 | 1992 | |
| Revenue | |||||||||
| passenger | 48046 | 55308 | 55761 | 59453 | 64107 | 65537 | 75030 | 78749 | 93936 |
| freight | 50837 | 53221 | 52387 | 54431 | 56011 | 57857 | 58645 | 56864 | 53403 |
| others | 17332 | 20749 | 25661 | 29658 | 28485 | 31064 | 38066 | 32528 | 34894 |
| total | 116215 | 129278 | 133809 | 143542 | 148603 | 154458 | 174996 | 168141 | 182233 |
| expenditure | |||||||||
| personnel | 145689 | 142655 | 146242 | 147791 | 144063 | 150114 | 162044 | 178754 | 187862 |
| materials | 111205 | 101619 | 99310 | 97779 | 96985 | 100859 | 117728 | 125721 | 134880 |
| depreciation | 20252 | 23704 | 25848 | 28642 | 30958 | 35343 | 38400 | 50178 | 60038 |
| interests | 70134 | 64965 | 64247 | 62348 | 62515 | 58947 | 63051 | 68547 | 83553 |
| extra.results | 1730 | 0 | 0 | -1067 | 0 | 0 | -7323 | 6846 | 13876 |
| total | 349010 | 332943 | 335647 | 335493 | 334521 | 345263 | 373900 | 430046 | 480209 |
| Subsidy | |||||||||
| PSO | 98885 | 92115 | 96751 | 107111 | 109447 | 112661 | 118928 | 124098 | 1405800 |
| Others | 70134 | 64965 | 64247 | 62348 | 62515 | 58947 | 63051 | 74288 | 87262 |
| total | 169019 | 157080 | 160998 | 169459 | 171962 | 171608 | 181979 | 198386 | 227862 |
| RBDI | -140679 | -114996 | -111743 | -102028 | -92445 | -96515 | -104776 | -136334 | -140509 |
| Operating | -232795 | -203665 | -201838 | -191951 | -185918 | -190805 | -198904 | -261905 | -297976 |
| Management | -63776 | -46585 | -40840 | -22492 | -13956 | -19197 | -20180 | -63519 | -70114 |
| Management* | -62046 | -46585 | -40840 | -21425 | -13956 | -19197 | -12857 | -56673 | -56238 |
| 1984 | 1985 | 1986 | 1987 | 1988 | 1989 | 1990 | 1991 | 1992 | |
| Revenue | |||||||||
| passenger | 84143 | 87027 | 80643 | 79028 | 80925 | 78941 | 88458 | 83395 | 93936 |
| freight | 89031 | 83743 | 75763 | 72353 | 70705 | 69690 | 66266 | 60219 | 53403 |
| others | 30354 | 32648 | 37112 | 39423 | 35958 | 37418 | 43013 | 34447 | 34894 |
| total | 203527 | 203418 | 193518 | 190803 | 187589 | 186049 | 197737 | 178061 | 182233 |
| Costs | |||||||||
| personnel | 255145 | 224467 | 211499 | 196451 | 181858 | 180817 | 183102 | 189300 | 187862 |
| materials | 194753 | 159897 | 143625 | 129973 | 122429 | 121488 | 133027 | 133139 | 134880 |
| depreciations | 35467 | 37298 | 37382 | 38072 | 39080 | 42572 | 43390 | 53139 | 60038 |
| interests | 122826 | 102222 | 92916 | 82876 | 78916 | 71003 | 71245 | 72591 | 83553 |
| extra.results | 3030 | 0 | 0 | -1418 | 0 | 0 | -8275 | 7250 | 13876 |
| total | 611221 | 523884 | 485421 | 445955 | 422282 | 415880 | 422489 | 455419 | 480209 |
| Subsidy | |||||||||
| PSO | 173177 | 144942 | 139924 | 142377 | 138160 | 135704 | 130705 | 131420 | 140580 |
| Others | 122826 | 102222 | 92916 | 82876 | 78916 | 71003 | 71245 | 78671 | 872622 |
| total | 296003 | 247164 | 232839 | 225254 | 217076 | 206707 | 201950 | 210091 | 227862 |
| Results | |||||||||
| RBDI | -246371 | -180945 | -161606 | -135621 | -116698 | -116255 | -118392 | -144378 | -140509 |
| Operating | -407694 | -320466 | -291903 | -255151 | -234693 | -229830 | -224752 | -277357 | -297976 |
| Management | -111691 | -73301 | -59064 | -29898 | -17617 | -23123 | -22802 | -67267 | -70114 |
| Management* | -108661 | -73301 | -59064 | -31316 | -17617 | -23123 | -31077 | -60017 | -56238 |
SOURCE: PÉREZ SANZ (1992). MANAGEMENT REPORTS 1991, 1992. RENFE NOTE: (A) THE SUBSIDY FOR ANTICIPATED RETIREMENTS (O.M. DEL M DE TRABAJO, DECEMBER 1986) WAS NOT INCLUDED, NEITHER AS REVENUE NOR AS EXPENSE, IN ORDER TO OBTAIN A CONSISTENT COMPARISON. THIS SUBSIDY AMOUNTED 8075 MILLION PTAS IN 1987, 11075 M. PTAS FROM 1988 TO 1991, AND 3000 IN 1992. (B) PSO INCLUDES REGIONAL, CERCANIAS, INCENTIVO, INFRASTRUCTURE, AK LINES AND NORMALISATION. (C) RBDI: RESULTS BEFORE DEPRECIATIONS AND INTEREST, IS THE DIFFERENCE BETWEEN TOTAL COST AND INCOME FROM TRAFFIC. (D) OPERATING RESULTS: RBDI PLUS DEPRECIATIONS AND INTERESTS, (E) MANAGEMENT RESULTS: OPERATING RESULTS PLUS SUBSIDIES (F) MANAGEMENT* DOES NOT INCLUDES EXTRAORDINARY RESULTS (G) REV/COSTS DOES NOT INCLUDE "OTHER REVENUE".
RENFE financial results for 1992
The next four tables show the financial results for 1992. The tables show
• Management Results (Total Revenues and Expenses)
• Revenues and Expenses of Operating Business Units before Subsidies and Common Costs
• Direct and Transfer Expenses and Revenues of Business Servicing Units
• Revenue and Expenses of Infrastructure Management Business Units
The contents of these four tables are as follows.
Management Results (Total Revenues and Expenses) 1992
This table shows the revenue for the different business units, together with the OSP and incentive subsidies allocated to specific business units. From this table it is possible to derive the total financial losses of RENFE in 1992 before receipt of government subsidy. This was 301,976 million pts., made up as follows:
| OSP, Regional | 19,139 |
| OSP, Commuter | 17,793 |
| Incentive, Commuter | 6,300 |
| Infrastructure Compensation | 92,670 |
| Other Compensation | 91,690 |
| Subsidy Decree 86 | 3,000 |
| Trading Loss | 57,508 |
| Extraordinary Negative Results | 13,876 |
| Total | 301,976 |
This sum is equal to 1.65 times the revenue of 182,233 million pts from rail users.
Management Results (Total Revenues and Expenses), 1992 (Millions of Pesetas)
INCOMES
| Passengers | 137,168 | |
| AVE | 8,440 | |
| Long Distance | 53,864 | |
| Regional | 9,303 | |
| OSP* | 19,139 | |
| Commuter | 22,329 | |
| Incentive | 6,300 | |
| OSP* | 17,793 | |
| Goods | 53,403 | |
| Full Loads | 42,129 | |
| Fractionalized Loads | 11,274 | |
| Others | 34,894 | |
| Other Compensations | 184,360 | |
| Infrastructure | 92,670 | |
| Others | 91,690 | |
| Subsidy Decree 86 | 3,000 | |
| Total | 412,825 | |
| EXPENSES | ||
| Personnel | 187,862 | |
| Traction Energy | 29,220 | |
| Services and Materials | 105,660 | |
| Retirements Decree 86 | 3,000 | |
| Total | 325,742 | |
| RESULTS BEFORE DEPRECIATION AND INTERESTS | 87,083 | |
| Depreciations | 61,038 | |
| Interests | 83,553 | |
| RESULT OF TRADING YEAR MANAGEMENT | -57,508 | |
Also accounted for in the trading year are 13,876 million pesetas shown as extraordinary negative results. * Public Service Subsidy Source: RENFE Informe de Gestion del Ejercicio de 1992 June 1993.
Revenue and Expenses of Operating Business Units before Subsidies and Common Costs
This table shows the revenue and costs of the different operating business units shown in the previous table. As well as the traffic revenue, the table also shows income from transfers from other business units. The principles underlying the transfer prices are explained in the following section, section V, of this report.
There are two types of expenses for each operating business unit. The first, "operating expenses", consist of the costs of personnel, services and materials, depreciation and working capital expenses employed by each sector. The second, "handling charges", show transfer payments to the three business servicing units: stations and joint services; rolling stock maintenance; and traction. The next-to-last row of the table shows the operating loss of each of the operating business units. These figures will be used in the cost allocation exercise in section VII below.
Revenues and Expenses of Operating Business Units before Subsidies and Common Costs, 1992 (Millions of Pesetas)
| AVE Distance | Long | Regional | Commuter | Fully Laden Goods | Partially Laden Goods | Total | |
| Customer revenue | 9282 | 54953 | 9307 | 22758 | 42588 | 11403 | 150291 |
| By Traffic | 8440 | 53864 | 9303 | 22329 | 42129 | 11274 | 147339 |
| Others | 842 | 1089 | 4 | 429 | 459 | 129 | 2952 |
| Income from transfers | 1946 | 1025 | 2118 | 7187 | 3261 | 153 | 15690 |
| Total Income | 11228 | 55978 | 11425 | 29945 | 45849 | 11556 | 165981 |
| Operating expenses | 10301 | 28207 | 4682 | 25436 | 15436 | 12920 | 96982 |
| Personnel | 2455 | 3678 | 2534 | 14825 | 5701 | 3887 | 33080 |
| Traction energy | 680 | 0 | 0 | 0 | 0 | 0 | 680 |
| Services and materials | 5625 | 18508 | 268 | 5341 | 1808 | 6186 | 37736 |
| Depreciations | 1461 | 5718 | 1762 | 5238 | 7230 | 240 | 21649 |
| Working capital expenses | 80 | 303 | 118 | 32 | 697 | 2607 | 3837 |
| Handling charges | 396 | 40549 | 16625 | 21823 | 50115 | 5950 | 135458 |
| Stations | 96 | 9373 | 3416 | 4019 | 10690 | 1899 | 29493 |
| Maintenance material | 25 | 6430 | 4435 | 4437 | 3148 | 485 | 18960 |
| Traction | 0 | 22416 | 5425 | 10809 | 35086 | 2331 | 76067 |
| Others | 275 | 2330 | 3349 | 2558 | 1191 | 1235 | 10938 |
| Total expenses | 10697 | 68756 | 21307 | 47259 | 65551 | 18870 | 232440 |
| Contribution Balance-sheet | |||||||
| Before Compensation O.S.P. | 531 | -12778 | -9882 | -17314 | -19702 | -7314 | -66459 |
| Extraordinary result | 0 | 242 | 89 | 839 | 491 | 22 | 1683 |
' Public Service Subsidy Source: RENFE Informe de Gestion del Ejercicio de 1992 June 1993
Direct and Transfer Expenses and Revenues of Business Servicing Units
This table shows results for the three business servicing units. Their main source of revenue is the transfer payments from the six operating business units set out in the previous table, and, in the case of stations, from the infrastructure management business units. Their expenses, which consist primarily of the costs of the personnel and materials they employ, are broadly in balance with their income.
Direct and Transfer Expenses and Revenues of Business Servicing Units, 1992 (Millions of Pesetas)
| Stations and Joint Servs. | Rolling Stock Maintenance | Traction | Total | |
| Customer Revenue | 3079 | 16525 | 17 | 19621 |
| By Traffic | 0 | 0 | 0 | 0 |
| Others | 3079 | 16525 | 17 | 19621 |
| Income from Transfers | 51744 | 33143 | 81396 | 166283 |
| Long Distance | 9373 | 6430 | 22416 | 38219 |
| Regional | 3416 | 4435 | 5425 | 13276 |
| Commuter | 4019 | 4437 | 10809 | 19265 |
| Full Loads | 10690 | 3148 | 35086 | 48924 |
| Partial Loads | 1899 | 485 | 2331 | 4715 |
| Infrastructure Management | 21384 | 536 | 475 | 22395 |
| Traction | 773 | 13647 | 0 | 14420 |
| Others | 190 | 25 | 4854 | 5069 |
| Total Income | 54823 | 49668 | 81413 | 185904 |
| Operating Expenses | 50545 | 49339 | 71106 | 70990 |
| Personnel | 36273 | 27812 | 35652 | 99737 |
| Traction Energy | 0 | 0 | 28540 | 28540 |
| Services and materials | 11139 | 19273 | 710 | 31122 |
| Depreciations | 3054 | 1010 | 6173 | 10237 |
| Working Capital Expenses | 79 | 1244 | 31 | 3154 |
| Handling Charges | 5644 | 1118 | 15007 | 21769 |
| Total Expenses | 56189 | 50457 | 86113 | 192759 |
| Contribution Balance-Sheet | -1366 | -780 | -4700 | -6855 |
| Extraordinary Results | -442 | -46 | -76 | -564 |
Source: RENFE Informe de Gestion del Ejercicio de 1992 June 1993
Revenue and Expenses of Infrastructure Management Business Units
This table shows the income and expenses of the two infrastructure business units, infrastructure maintenance and traffic movement. However their income consists of minor amounts of revenue, so the table is largely one of costs.
Revenues and Expenses of Infrastructure Management Business Units, 1992 (Millions of Pesetas)
| Infrastructure Maintenance | Traffic Movement | Total | |
| Customer Revenue | 3867 | 35 | 3902 |
| By Traffic | 0 | 0 | 0 |
| Others | 3867 | 35 | 3902 |
| Income from Transfers | 671 | 139 | 810 |
| Total Income | 4538 | 174 | 4712 |
| Operating Expenses | 80822 | 5657 | 86479 |
| Personnel | 30649 | 4839 | 35488 |
| Traction Energy | 0 | 0 | 0 |
| Services and Materials | 22592 | 639 | 23231 |
| Depreciation | 25318 | 147 | 25465 |
| Working Capital Expenses | 2263 | 32 | 2295 |
| Handling Charges | 1288 | 29352 | 30640 |
| Total Expenses | 82110 | 35009 | 117119 |
| Contribution on balance-sheet before compensations O.S.P.* | -77572 | -34835 | -112407 |
| Extraordinary Results | -5903 | 22 | -5881 |
*Public Service Subsidy Source: RENFE Informe de Gestion del Ejercicio de 1992 June 1993
V. Theory and practice of transfer prices
As has already been mentioned, the business units' success in the performance of their objectives will be controlled through their accounting results. It is therefore necessary that each be responsible for the revenue and costs they generate, and that these are defined in a clear way.
As we saw in the previous section, in a vertically integrated firm like RENFE there are business units that provide services to one or more other units (here the problem of allocation of common and joint costs may also arise), and there are also relations between other units whose main objective is not to be a provider of services. In such cases valuation of services by means of "transfer prices" are needed.
RENFE has not tried to allocate all its assets to the business units because it thought that this would not allow the units to detect surplus capacity. (This is the opposite to the method adopted by British Railways in their sector management system before privatisation). What RENFE have done is to allocate those assets that are more specific: rolling stock, stations and marshalling yards that are devoted to Cargas will be managed by this business; stations that are used to control the traffic will be transferred to Circulation, etc.
The transfer price policy needs to be a policy of strategic coordination between the business units, since it will influence the demand and supply of services in the medium and long term, as well as the size of the Providers of Services business units.
As Gould (1964: 61) indicates, the transfer price mechanism may replace administrative coordination between the divisions in the same way that the price mechanism may coordinate a total decentralized economy. In the same way as this, the problems of imperfect competition, external effects and decreasing costs arise.
Gould indicates three main problems related to transfer pricing
(1) Transfer prices should be specified in such a way that the division can use it to determine its individual output policies in a way consistent with the maximization of the corporation's profits. This means that the transfer prices should be equal to the opportunity cost of providing the service to the corporation.
(2) The divisional profits may not reflect the efficient use of resources by the manager's division. This question has to be allowed for in order to judge the performance of the managers in a fair way. There is therefore a trade-off between the first two aims: one division may be acting in a consistent way with the objectives of the firm, but at the same time may be making losses.
(3) Practical problems of devising procedures to obtain transfer prices within the firm.
Ezzamel (1991: 61) reviews the different market situations where transfer prices can be derived following the classic economic theory. To do this is necessary to assume that quite restrictive conditions hold .
If the product can be traded in a perfect external market, the transfer price should be the market price, because it reflects the opportunity cost of the product/service to the firm. The division has to be free to contract with this external market. Doing this, each division would maximise their profits as well as the firm's profit. There would also be savings in information transmission. The resulting transfer prices may also be used to judge the performance of the managers in a fair way.
The assumptions are the following:
(1) the firm has two divisions.
(2) the work technologies are independent as well as the demand for their products/services.
The first condition means that the operating costs of each division are independent of the level of operations of the other. The second assumes that the external sales made for one division do not affect the external demand for the products of the other division.
(3) the main objective is the maximisation of the corporation's profits, and then the division does not have total autonomy in their activities. (Ezzamel, 1991: 61).
The existence of imperfections in the outside markets makes the internal trading between divisions more desirable because it can minimise some costs and uncertainties. There are some important features from the analysis of the case where the buyer and the seller prices are not equal:
- if overall profit is the objective, some external rules have to be imposed to avoid the use of monopolistic power, thus reducing the autonomy of the divisions.
• there are incentives for only one division to trade internally, if only one receives all the benefits from this action.
• divisional profit cannot be used to assess divisional viability in a rational way.
If the outside market presents major imperfections, internal trading is much more desirable. The above limitations are also present and there is the possibility of business units using information in their own interest rather than in that of the overall profit.
In the absence of outside intermediate markets, the best solution would be to produce the level of output that maximises the overall profit. If the final market is competitive price should equal marginal cost.
Ezzamel continues by considering the limitations of the traditional economic theory model:
• the traditional model assumes independence of technology and demand, conditions that are quite restrictive assumptions.
- it gives the most importance to the overall optimality at the expense of maintaining divisional autonomy, which may cause adverse behavioural consequences.
It also supposes that the top level of management can get the managers to act in favour of the overall interest, but this may not to be so: if the top level of management does not have the information to judge the managers' actions; or if the divisional managers act in their own interest and if the perception of risks of the managers leads to suboptimal actions.
• the use of TP being equal to marginal cost reflects the opportunity cost if the market for the intermediate good/service is highly competitive or if there is only one demanding division.
(1)
We can devise the optimal transfer price when there are different prices for the seller (Ps) and the buyer (Pb). There are different cases, depending on the relative position of these prices in relation to , that is the price where the marginal costs of the internal division (the curve that represents the opportunity costs for the firm to purchase externally instead of doing internally) intersects the net marginal revenue of the final division (the curve that represents the opportunity costs of selling externally when it is possible to do internally).
The case of RENFE is that of a firm faced with competition by road and other modes both in the freight and in the passenger markets. However these markets are quite regulated. Consequently the opportunity cost may not be the marginal cost. On the other hand, it is probable that more than one division demands the same resources, and then the opportunity cost would be the highest of the marginal costs or the revenue forgone by diverting resources from alternative uses.
As we will see in the joint cost section, the marginal cost is usually taken as the variable cost and then if the transfer price is set equal to variable costs the division would not cover its fixed costs and act as a profit centre. To avoid this problem, some intermediate system is sometimes used. This may consist of a unit variable cost plus a certain amount to cover the fixed costs. This charge may be negotiated according to the capacity that the seller devotes to the buyer. This method does not allow us to determine the existence of excess capacity in the seller division. Another method would be to charge the complete costs of the division, the fixed cost of the seller would then be translated into variables to the buyer. This procedure would neither show the surplus capacity nor allow us to find it.
In summary, the main limitations of the above analysis are the oversimplification of reality and not allowing for the organizational and behavioural considerations within the firm. One organizational issue in transfer pricing systems is their contribution to the requirements of differentiation and integration of company divisions. The system may improve the differentiation of the business units if the transfer price give the correct signals to those responsible for the different stages of production, for example to reduce surplus capacity. If the transfer price system is defined in a standard formula for instance, it can help to achieve integration between the divisions in the firms, facilitating trade within them and reducing the problems of negotiation, because in the case of absence of outside markets the transfer price may reflect the ability to negotiate rather than the ability to control their own costs.
In RENFE the transfer prices in 1991 were calculated by dividing the total costs between the different users, according to certain physical units. In 1992 this system was changed because it was thought that they transferred the costs due to excess capacity to the Transport Operators. In this way the providers of services lost all control over the improvement of any inefficiency in the provision of services.
In 1992 the prices were calculated by multiplying the 1991 transfer prices a series of coefficients that included (a) increases of the prices born by the Providers (energy, external services, unit cost of personnel, etc) and (b) specific targets of productivity improvements. In the case of Rolling Stock Maintenance, and Station and Joint Services, there was a readjustment of the transfer prices.
The Operators perceive the services as a variable cost, and there is then the possibility of translating the adjustments of their supply into better operating results. These changes affect the supply of the Providers of Services, because they may generate a resource surplus that would be translated into their accounts as a negative margin. The adjustment of their productive resources is the economic objective of these business units.
In 1993 the transfer prices, apart from those for energy, have been set equal to 1992 ones. This implies a global target of productivity improvement for these business units, that amounts to the increase in their unit costs. In the Operating Budget 93, an identification of excess capacity has been determined, broadly in the form of excessive personnel and locomotives.
We will consider some of the transfer prices of the different sectors, according to the most recent information we have (RENFE, 1990). In this document there is a comprehensive study of the different costs that each unit has to transfer, the desirable transfer prices and the physical units on which to base them, and also some conventions about the responsibility that each unit has for different actions. This is the way to ensure that each section is acting in accordance with the global interest of the company. Most of the transfer prices are based on costs, because there are few possibilities for trading in external markets. One important consideration is that there is a search for simplicity, because in the beginning of the system it was not thought to be helpful to use too exact or complicated a system.
1. Traction
Transfer prices have been based on loco-minutes (personnel), GTKH (energy), and loco-kms (depreciation and maintenance). These are variables that can represent causation of costs in a fairly clear way. In the first stages of the system there was no discrimination between diesel/electric, type and class of locomotive. There is a problem because the business unit has to use its resources in the most efficient way that may not coincide with the demands of the operators. Instead of this more realistic system, an average price has been set. This method could be improved when the transfer system becomes more developed. Responsibility for locomotive renewal was also allocated to the Traction business unit: the decision as to whether or not to replace a locomotive comes from a comparison between the average price and the unit costs of each locomotive.
2. Rolling stock maintenance
There were two systems in mind when the system was devised. The first consisted of charging the business units for any expenditure incurred with the technical responsibility of the program of maintenance being that of the owner of the equipment. The second and preferred option consisted of paying a charge per train-km as a payment for the commitment of the business unit to adopt this technical responsibility. With this system the maintenance includes all kinds of operations (apart from the major repairs). It also incorporates a premium or penalty for the quality, reliability and availability of stock.
Major repairs (in the case of accidents or renovation) are considered as a special case because of their importance. This is the appropriate time for assessing the desirability of investment in rolling stock as a part of the overall decision on services. For instance a program of complete renovation of old locomotives could be avoided if the service on which they are used is found not to be profitable.
3. Station and joint services
The document is not very explicit on the different kinds of services, and the appropriate transfer prices. It may be due to the non-specific type of the services offered. In general the charges should consist of a fixed amount plus a variable one. Then each business unit would receive a fixed cost depending on the number of stations used, and a variable one depending on the actual use made.
The services include a large list of activities:
• passenger terminals: the transfer price consists of a charge per passenger weighted by the services provided. This point seems to be a matter of negotiation rather than a fixed price.
• sale of tickets and freight check-in: they will be charged according to the number of tickets.
- loading and unloading of freight: the costs will be translated to the Cargas business unit in the form of an average price. It is possible to consider contracts with other parties.
- marshalling, shunting and cleaning of trains: the transfer prices suggested are quite vague, but they seem to be based on costs, as well as the services to particular divisions.
- traffic information: these will be incorporated as a percentage addition to the other services because there is no other basis for allocating them.
circulation: the costs will be transferred to the Circulation business unit.
• delegated services: they may include activities done by the station as a result of its geographical situation: customers' attention, after-sales activities, concentration and dispersion of parcels, etc. This cost will be included directly, or as a percentage in the total service.
• use of buildings and other assets: there is no transfer to other business units for the use of buildings apart from the general expenses.
4. Paquetería
The special operating characteristics of this business unit makes the definition of transfer prices necessary. When the business unit uses their own trains (for instance Cargo Express) it has to pay the costs of traction and stations. It may operate by including some wagons on passenger or other freight trains. In the former case the passenger business unit will only charge the marginal cost caused, in terms of traction energy depending on the GTKH (gross tonne-km hauled or TKBR). In the latter case the system changes because Paquetería will receive transfer charges reflecting traction costs including personnel, energy and depreciation, and marshalling and station costs. The last possibility comes when this business unit does not use a complete wagon but a part of it, and then according to the marginal cost principle should not be charged at all apart from the extra stops it requires.
5. Cargas completas
This business unit will receive all the costs of the stations that it uses specifically, and also all the specific computer system it uses. It will also pay for traction and for station services, and will charge Paquetería those costs that could be associated with its activity.
6. Passenger operators
Frequently a train will consist of rolling stock from different business units. In such a case there is a transfer price at the cost price, including maintenance and traction.
VI. The joint cost question
In this section of the report we consider the joint cost problem of allocating costs to different railway sectors or business units. These problems arise in particular with infrastructure costs.
Alternative cost classifications
The literature on railway costs uses similar concepts under different titles. It may be worthwhile to mention different forms of cost classification:
(1) Variable, semi-variable and fixed
• variable: are those costs that vary with output, for instance train crew and energy.
• semi-variable: for instance vehicle maintenance, depreciation and terminals.
- fixed: are those cost that do not vary with changes in output. Under this heading would be track, signalling, administration and general expenses.
(2) Direct and indirect
This is similar to the above classification, the direct costs being those that vary with output (variable and semi-variable) and the indirect costs being those that do not (fixed).
(3) Avoidable and non avoidable
The first category are those that could be saved if a certain activity ceases operation. The other costs would continue to be incurred.
(4) Specific, common and joint costs
- specific: these are the costs that can be allocated to a certain activity/sector and that could be removed if the sector no longer exists. For instance, if a service is run with special trains that are not shared with another sector, i.e. AVE, all the personnel costs of operating the service could be allocated to it.
- common : these are the costs shared between two or more activities which can be attributed to them according to some physical unit of output. Such costs could be reduced by a certain proportion if one of the activities were removed. Most of the personnel cost could be included in this category, for instance station and marshalling staff. In the same way some of the signalling, terminal and track facilities are common to some services, and could be reduced with changes in their output.
- joint: the cost of providing two or more products or services whose production cannot, for physical reasons, be separated; providing one service automatically makes the facility available for another (British Railways, 1979: 25). These joint costs are then the costs of facilities shared with another service which cannot be reduced at all if the service under consideration is withdrawn. The typical example would be the earthworks, tunnels, bridges, etc.
The separation between these different cost categories is not fixed because it depends on the aggregation of the services. For instance some specific costs to freight, i.e. marshalling yards, are joint between the different types of freight traffic.
Beesley and Kettle define joint costs as the difference between total costs and the sum of avoidable cost if all the services were withdrawn alternatively, keeping the other sectors constant. They are then the costs that cannot be attributable to a single service but only to a mix of them. These authors distinguish two types of such non attributable costs: those arising from technical necessity (as with track capacity this would be the cost of one single track maintained at minimum standards) and those arising from economic convenience where the possibility of separate production does exist (for instance the use of big wagons, if well utilised, provides significant economies of scale) (Beesley & Kettle 1985: 21).
Measurement of the profitability of the overall activity of RENFE is not a problem because it is simply equal to revenue minus costs. However, if we are concerned with the profitability of the different sectors/subsectors the problem of how to allocate the costs arises. The analysis of sector costs is important because it allows managers:
• to know the financial/social worth of retaining, withdrawing or opening some services.
• to know the financial/social worth of accepting or refusing some traffic.
Stewart Joy (1964, 1971) was one of the authors who tried to change the classical view about the problem of common and joint costs. Joy argued that traditionally it was thought that the railways business had a large proportion of fixed costs. Then additional traffic could be attracted with a small increase in total cost, and welfare could be maximised by charging the marginal cost of carrying this traffic. This practice was broadened to the rest of the traffic, only recovering the short run variable costs.
The mistake in this argument was the estimate of the marginal cost. Joy showed that some of the "fixed" cost could be avoided if the production of some services were reduced. For example double or multiple track may be converted into single track, the standard of track maintenance may be downgraded to a minimum level, administrative costs may be cut, etc. There is then "the possibility to change over the wide range of present costs and long-run fixed costs, and that all expenditure above the long-run fixed costs should be recognized for what it is: a variable cost, due solely to the level and pattern of demand, and avoidable at the railways' option" (Joy, 1964: 145).
The existence of different categories of track maintenance reinforces this idea. We have mentioned in section I that RENFE has divided its network into four categories (A1, A2, B and C), according to the number of trains and the speed at which they can travel. Each category is provided with the capacity needed to match the demand, with different signalling facilities and different quality of track maintenance.
We will next explain different methods of calculating the profitability of railway activities through the allocation of costs. However, the importance given to the allocation of costs does not mean that there are no problems on the revenue side. One of the reasons argued against the closure of certain unprofitable local services was that they may provide additional revenue to other rail services in the form of "contributory revenue".
1. Total cost allocation
Here sector profitability is obtained by sharing all the costs among the sectors, on the basis of some physical units of output. We have already mentioned the problem that some fixed or indirect joint costs (terminal, track and signalling) have to be allocated arbitrarily. This method ignores such difficulties and allocates such costs in terms of the train-kms, tonne-kms, train-minutes. This may be an acceptable method if the percentage of those costs is low or when the output is homogeneous.
This method does give a false view of the potential cost savings if a service is reduced or withdrawn. Let us consider the example of a route where a social passenger service and a profitable freight service operate, the first one causing the main part of the infrastructure cost of the route, and the second adding only a smaller part of such costs. If the total costs were shared according to the total cost allocation method, it might be the case that the freight service then appeared to be unprofitable and was withdrawn. The social service would have to support all the costs, and this is clearly a suboptimal situation.
2. Accounting contribution
This method only charges the sector/product/activity those costs that may be directly and specifically related with its output. The margin between revenues and costs is the contribution to the indirect joint, unallocated, costs. The sector's financial performance is then judged by the level of contribution according to some standard (per unit of output), rather than in absolute profit levels. These targets can vary to allow for some kind of constraints, to produce a flexible system of evaluation. The problem is that the appropriate level of contribution each service was expected to make is not always clear.
How can we use this method to assess the financial worth of traffics? The minimum level of acceptance would be that prices should cover the short run marginal costs, which should be obtained using the next method (avoidable costs). Some kind of discrimination is also needed to rank the value of traffics and then to ensure the optimum allocation of resources to the alternative traffics. The major theoretical justification for the retention of this method in Britain before the 1980s was the supposed invariability of infrastructure cost with changes in traffic volume, the traditional viewpoint that Joy has criticised. The accounting contributions method does not give sectors responsibility for infrastructure costs and there was a risk of under achievement and extending short-run activities into a longer period. (Allen, 1989:101)
RENFE has adopted this method in the sense that no business unit is going to be responsible for the infrastructure cost that each may cause. We have seen that the justification of doing so was so that railways were to be treated in the same way as road haulage, rather than the classical argument that railways had a high proportion of fixed costs.
3. Avoidable costs
This method tries to identify those costs that can be associated with a specific activity, and those that are indirect joint costs. This latter category can only be allocated in an arbitrary way. This analysis tries to answer two questions: (British Railways 1979: 18)
• for each element of cost; does it vary with the output of any individual sector/service?
• if a particular activity/sector no longer exists, which costs would be avoided?
This separate identification of the specific costs gives a high degree of certainty in profitability evaluation. This is a useful approach in industries where the joint indirect costs are a high percentage and where it is necessary to have a reasonably exact view of the sector profitability, including some element of joint indirect costs. In this context the avoidable element of evaluation of the indirect joint costs offers some measure of what the contribution of a sector should be.
To determine cost causation Joy (1971: 11) suggests that the best way will be to find the peak period and study the mix of trains. If in this peak period there are some passenger services with a short headway (it could be the case of Cercanías in Madrid), they will determine the track and signalling requeriments. The trains that operate off-the-peak will cause a small amount of additional costs, for instance tear-and-wear costs. The question needed to determine the causation of costs would be that of which costs could be saved by eliminating trains and rearranging the remaining. Joy continues by saying that the effects of this method are that (1) if there are predominant traffics on certain routes, these services should pay most of the costs of the route and (2) on all routes, each traffic should earn enough to cover the costs of the facilities that they use exclusively.
The avoidable cost method gives us (1) the minimum revenues (or social benefits) that particular traffics should generate to survive, and (2) also sets the lower limits to their respective prices.
The application of first of these two principles to the closure of lines may be explained with the following example (Dodgson, 1977: 164). Let us suppose there is a route where two services operate. The first is a social passenger service obtaining social benefits and causing specific costs by (including all the avoidable ones). The second is a freight service with social benefits and costs . The unallocated joint costs for both would be J. These joint costs may be shared stations, signalling facilities etc. It is important to note that these joint costs could be avoided if both services were withdrawn. The rules for the closure of individual services would be and . If one on them covers its specific cost and not the other, the latter service should be withdrawn. The condition for the remaining service to be maintained would be . Another possibility is when both services cover their respective specific costs but together they do not generate enough contribution to cover the joint costs. In this case both services should be withdrawn.
The second principle is explained by Joy (1971). He argues that where the freight market is a competitive one, the railway should take the road haul price as given and accept the traffic if at this price (or a lower one allowing for the better quality of the road service) the railway can cover the avoidable costs of the freight traffic and if possible make a contribution to the unallocated joint costs. If possible, prices should then discriminate between traffics in order to maximise the contribution made toward joint costs.
RENFE is actually adopting this approach in the freight sector, but without taking the infrastructure costs into account as Joy suggested. The managers assume that at their actual operating costs they are "out of market" in some cases, because the price the market is prepared to pay is lower than their costs. There are two solutions: either abandon the traffic or reduce railway costs. The second possibility was the preferred one though the most unprofitable traffics are being abandoned. This policy requires a good knowledge of the costs and prices of the competitors and of course a better understanding of RENFE's own costs.
This strategy can also be applied to the commercial passenger services, where there is competition from regular coach services and also from airlines. RENFE would need to study the prices and costs of these operators to consider the desirability of undertaking different actions such as reducing or increasing services by a smaller or larger percentage. The case of AVE may be a good example. The price of AVE has to be set with reference to the other modes. The AVE's fare is higher than coach's because of the higher rail quality, in terms of travel time. On the other hand, the AVE fare is cheaper than Iberia's flights, providing a similar level of service (Iberia obtains profits in certain routes of the domestic market, which compensate the losses that other unprofitable services generate (inland flights, for instance)). RENFE's policy may be justified in economic terms if revenue from traffic covers the avoidable costs it causes and also provides a contribution to joint infrastructure costs, and at the same if time there are considerable benefits to consumers. This latter point is evident by the large percentage of generated traffic. Another issue would be that at the first stages of its operations AVE may be trying to attract people, charging a low price to attract custom. The ratio of revenue from traffic/operating costs of 0.79 in 1992 may support this belief.
Finally it is important to note the problem that the non avoidable cost may be a large percentage of the total infrastructure costs. Allen (1989: 99) says that in the UK they amounted to over 50 per cent of all infrastructure costs. This did not meet the basic requirement that managers have responsibility for all costs. This was added with the next cost allocation methods, the prime user and sole user methods. These were adopted by British Rail with its system of sector management in the 1980s, but are being abandoned with privatisation and the split (see below) between infrastructure and operations.
4. The prime user costing method
This method allocates the infrastructure costs of each section of route (or other kind of joint cost) in a bottom-up way. Firstly, a hierarchy of users in an increasing order of importance is determined. The next step is to obtain the costs that could be avoided if the least important sector were removed, and so on. At the end the prime user is allocated all the remaining costs, including those that cannot be attributed to the other sectors. Therefore any surplus capacity is not identified.
The method presents a number of problems:
- the allocation of costs depends on the hierarchy. This ordering has to be chosen section by section in order to treat all the users in a fair way. However it could be a matter of dispute between sectors.
- it supposes that once one sector is removed the other will be operating its previous level of service. In practice there may be some benefits if the existing users were to reorganise their services to make better use of the remaining infrastructure facilities.
• the avoidable costs are influenced by variations in the timetable.
- the infrastructure cost on each section of route is an average of annual costs, if allowances for renewal of particular categories of infrastructure are included. The saving of costs, from the withdrawal or recturing of services, has to take this fact into account, especially if renewals were imminent (Dodgson 1984: 229).
5. The sole user costing method
The process is the reverse of the prime user method before (top-down). The costs of having the optimal capacity for the services of the primary user in the hierarchy are calculated, and then those of the rest are added in. The advantage is that it is possible to compare the sum of the costs calculated for each user with the existing track costs in order to identify any surplus capacity. This surplus capacity may be of two main types:
• physical surplus: too many tracks, switches or signals for modern traffic requirements.
- technological surplus: this is rather more complex and relates to the most cost-effective pattern of services which can often be obtained with modern facilities and, in particular, modern signalling, and which by definition are not present where the facilities which actually exist are old and technologically obsolescent (Allen, 1989: 104).
We could consider a hypothetical example of how the prime and the sole user methods could work in the case of RENFE. Let us consider the section of route (code 102) between Villalba de Guadarrama and Herradón. In this section there are the following services: ten kms of line C-8A Madrid Atocha-El Escorial; Regionales (Regional and R.Express), Largo Recorrido (Diurno, Talgo, and Estrella), and also some freight trains. The cost of infrastructure maintenance was 352 million ptas. The hypothetical order of increasing traffic density could be Freight, Cercanías, Regional, and Largo Recorrido. The savings in costs would be, let us suppose, 30, 60, 90 if the first three were removed,. These would be the figures for which each one would have to be responsible. The remaining costs of 172 million ptas would be allocated to L.Recorrido, according to the prime user assumption. In the case of sole user, L.Recorrido would have to determine the optimal capacity it would need if it began to operate. Let us suppose that this business unit assesses its needs at 150 million per annum. The incremental cost of the other UNes could be 70, 50 and 20. The sole user, in this case L.Recorrido would charge the others these incremental costs. The remaining 62 million ptas would be the surplus capacity that should be reduced. These costs should be allocated to the different business sectors so that they do have the incentive to remove them.
6. Complete separation of infrastructure and operations with charging systems for access to the network
This is the approach which is being adopted in Great Britain as a consequence of the 1993 Railways Act. From April 1st 1994 railway infrastructure will be provided by a separate company, Railtrack. Railtrack will initially be in the public sector, but will eventually be privatised. Railtrack will set access charges, which will be required to cover all its costs and earn a rate of return on capital. The required rate of return on assets valued on a replacement cost basis is likely to be set at five per cent in the first year of operation, 1994/95, rising to eight per cent a year in later years.
Passenger services will be franchised on the basis of a division of the passenger sectors into about 25 separate businesses. Subsidies will be provided for unprofitable services, with potential franchises bidding on the basis of the lowest subsidy needed to operate the service. Rail freight operating companies will be transferred to the private sectors, and there will be "open access" for new rail freight operators and, in due course, non-franchised passenger train operators. Both franchised and non-franchised rail operators must pay track access charges, which will have to be negotiated with Railtrack. Track charges for franchised passenger services will be negotiated between Railtrack and the government-appointed Franchise Director, who will be responsible for the allocation of subsidies through the Office of Passenger Rail Franchising (OPRAF).
An underlying principle of the access charges is that they must at least cover the avoidable costs of the train operator's services. These avoidable costs will first cover usage-related charges. The track usage charges reflect the costs of wear and tear of trains on track, and will vary with the type and number of trains. Electric trains will also pay for their current through traction current charges, since electricity supply through the catenary or third rail will also be provided by Railtrack. In addition, Railtrack intend to levy peak charges, reflecting costs of access to the network where infrastructure is congested at peak times: the basis for assessing such peak charges has yet to be determined. In addition to all these variable, or usage-related charges, fixed costs will be divided into two main components. Directly attributable fixed costs are the long-run avoidable costs that arise specifically because of the infrastructure requirements of a particular operator. For example, if a particular franchised passenger operator is the exclusive user of a particular section of route or signalling facility, all the costs of that route or facility will be charged to that operator. The remaining infrastructure costs which Railtrack will need to recover from its customers are the common costs. In turn these are divided into three categories.
• Common costs incurred for the use of specific sections of track. These are costs which cannot be counted as avoidable to any of the users of a particular section of route which carries the trains of more than one train operator.
• Common costs which can only be identified to a geographic area. These are costs such as those of power signal boxes which cover a number of routes used by different train operators.
• Network costs. These are costs of providing the network which cannot be allocated more specifically to individual routes or geographic areas.
Similar principles apply to freight train access charges, which must at least cover avoidable costs, and must also make a contribution towards common costs. Access for freight train operators will be charged on a two-part basis. The network charge will be linked to the planned route mileage used by the service, while the tonnage charge will be related to the gross tonne miles of traffic actually hauled. Some government grants will be available to cover such charges where the freight flow is not otherwise financially viable by rail, but where there are potential environmental benefits.
VII. Infrastructure cost allocation exercises
In this Section we report the results of two infrastructure cost allocation exercises.
1. Total cost allocation:
This infrastructure allocation exercise was conducted using infrastructure cost data from the Manual para la Evaluación Económica de Proyectos de Inversión en Vía Ancha, 1985, MOPT. This report showed the average cost of five categories of infrastructure, dissagregated between single and double track. They are reproduced in the next table.
| 1984 | 1990 | physical units | |||
| single | double | single | double | ||
| track,bridges and tunnels | 0,3179 | 0,1677 | 0,4727 | 0,2494 | ptas/GTKH |
| security installations | 31,98 | 24,52 | 47,56 | 36,46 | ptas/train-km |
| telecommunications | 13,67 | 9,28 | 20,33 | 13,80 | ptas/train-km |
| catenary | 36,47 | 25,76 | 54,24 | 38,31 | ptas/train-km |
| substations | 29,09 | 16,13 | 43,26 | 23,99 | ptas/train-km |
We presume that the values were calculated by dividing the total cost of each item by the number of train-kms or GTKH. We did not have data on the total train-km and GTKH in 1985, and so we could not calculate the total infrastructure costs for this year. Instead we have translated the 1985 average costs data into 1990 values using the RPI. The physical units we used to allocate these costs were train-km and GTKH (gross tonne-km hauled) for each section of route, divided between passenger and freight traffic, for the year 1990. These were published in the document Renfe en 100 Mapas, 1990. We multiplied these physical units by the relevant average costs at 1990 prices to allocate infrastructure costs to the passenger and freight businesses (catenary and substation costs were only allocated to the electrified section of routes).
As a result of this exercise, 26,917 million ptas of infrastructure were allocated to the passenger business, and 15,159 million ptas to the freight business, a total of 42,076 million ptas. This total is less than the figure of 57,603 million ptas that appears under the Contrato-Programa for 1990 under the heading of vigilance and conservation. In addition, 18,980 million ptas were provided to cover the depreciation costs.
Some of the reasons for this gap may be:
- the figure of the Contrato-Programa includes "other works", that is building and machinery maintenance, works for third parties, level crossing, works that are considered investments; and also the costs of operating centres not devoted to maintenance.
• within the train km in electrified track, there are also a number of train-km and GTKH by diesel trains, though this is a small percentage.
• if the number of GTKH and train-km has fallen, average costs should have increased.
- the figures do not include internal service trains. These amounted to 23 per cent of total train-km and 4 per cent of GTKH in 1990.
2. Allocation to the main user.
This exercise is based on RENFE's data on the infrastructure costs of each section of route (there are some 225 such sections). All the costs of each section of route are allocated to the business sector which we assess to be the main user of that section of route. Freight is only presumed to be the main user of those sections of route which are freight-only and do not serve any passenger trains. This means that we did not allocate any other infrastructure costs to freight trains, even though freight trains will impose some infrastructure requirements (freight loops, marshalling yards, etc), and cause track wear-and-tear, elsewhere on the system. This means that the overall proportion of infrastructure costs allocated to the freight business will be low. Cercanias services are also allocated all the costs of the sections of the route they use. Regionales were allocated all the costs of the routes they used exclusively, plus some others where the trains were mainly from the Regionales sector. Finally, Largo Recorrido was allocated the costs of the remaining section of routes (the greater number). In order to determine the main user of each section of route it was necessary to study the RENFE passenger train timetable, link by link, to decide which were the main users of each section of route depending upon the number of passenger trains scheduled per day. The resulting infrastructure cost allocation was as follows:
• Freight: 881 million ptas
• Regional: 4,266 million ptas.
• Cercanías: 10,206 million ptas
• Largo Recorrido: 21,834 million ptas
• Total: 37,187 million ptas.
To this total we can add: costs caused by accidents (2,052 million ptas); by "other works" (2,748 million ptas); by level crossings (5,032 million ptas) and by non maintenance operating centres (1,212 million ptas). This yields a total figure of 48,231 million pts.
This figure also differs from the Infrastructure Maintenance costs for 1992, which were 82,110 million ptas, including personnel, materials, energy, depreciation and financial (the costs of AVE infrastructure are incorporated into the total costs). If we suppose that in the above figure of 48,231 million ptas, the financial expenses and depreciation were not included, the result would be 76,814 million pts which is much closer to the total costs of 82,110 million pts which appears in RENFE's 1992 "Revenue and Expenses of Infrastructure Management Business Units" table in Section IV of this Report.
The next step is to add the infrastructure costs we have allocated to the different business units to their operating losses. These operating losses before compensation appear in RENFE's "Revenue and Expenses of Operating Business Units before Subsidies and Common Costs", which are also reproduced in Section IV of our Report. The resulting overall losses are:
• Freight: 27,016 + 881 = 27,897 million pts.
• Regionales: 9,882 + 4,266 = 14,148 million pts.
• Cercanías: 17,314 + 10,206 = 27,520 million pts.
• Largo Recorrido: 12,778 + 21,834 = 34,612 million pts.
• Total (excluding AVE) = 66,990 + 37,187 = 104,177 million pts.
These figures give us a very approximate idea of the losses that the different business units might actually incur if they were charged a part of the infrastructure costs. In order to have a better idea of the resources that are devoted to the business units from the rest of the economy we would have to add to these results the remaining infrastructure costs not allocated in this exercise plus the investments of each business unit.
VIII. Conclusions
As in other European countries, railways in Spain have been losing market share to other modes, and particularly to road traffic. This has been particularly the case with regard to freight transport. The result has generally been increasing financial deficits, which governments have needed to respond to. In particular, the role of the railway in the overall transport system has had to be redefined.
RENFE and the Ministry of Transport have accepted this need for change. Railway managers have been freed to make commercial decisions, and have become responsible for their own performance. For example, the Ministry of Transport has given RENFE increasing freedom to set their fares for Largo Recorrido services and their charges for rail freight services.
In determining responsibilities and objectives, an important distinction is that between services which are provided for social reasons, and those that should be operated commercially and without subsidy. The distinction between such services is not always clearly defined. Cost-benefit analysis might be used to determine the appropriate dividing line between commercial and non-commercial services, but in practice the precise boundary will be difficult to determine. Cost-benefit analysis might also be used to determine the appropriate balance between service levels and frequency levels, since a given subsidy level might be associated with a low fare, low frequency, service, or with a high fare, high frequency, service.
A major issue in determining the optimal level of railway service is the treatment of infrastructure costs. The total costs of providing railway service will depend on infrastructure costs as well as on operating costs. Consequently financial accounts which leave out infrastructure costs will be incomplete. Decisions to subsidise particular railway services for social reasons will usually have implications for the level of infrastructure to be provided, and these costs need to be included when assessing relative costs and benefits. As we have seen, RENFE's present accounting methods do leave out infrastructure costs when the profits or losses of the individual Transport Operator business units are assessed. This means that there is only a partial picture of the financial costs that have to be incurred in order to secure particular social benefits.
One result of this is that, as the discussion on page 23 indicates, the total losses of the Transport Operating business units, even after inclusion of OSP subsidies, sum to a much smaller total than the overall financial loss of RENFE in 1992. Consideration only of the financial losses of the operating business units might divert attention away from the fact that substantial financial resources are being absorbed elsewhere in the railway system. In addition, there may be insufficient pressure to secure efficiency in the provision of infrastructure, both in terms of only providing that infrastructure whose provision is justified by the benefits of the services which use it, and in terms of securing infrastructure provision at minimum cost.
Without such incentives for the effective use of infrastructure, RENFE and the Ministry of Transport may find infrastructure subsidies rising even if operating subsidies are kept under control. This will again create pressure for organisational reorganisation of the railways. We think that a much better alternative would be to allocate infrastructure costs to the operating business units so that they have the incentive to secure cost-effective provision of the amount of infrastructure necessary for their own services. In addition, cost-benefit studies can then consider all the relevant costs incurred in securing social benefits from the railway network.
In short, infrastructure is not a free good, and should not be treated as such. We think that the best way to allocate infrastructure costs would be on the basis of the types of prime user and sole user method used by British Rail and described above in Section VI of this Report. This would require a detailed exercise, but RENFE do already have very detailed data on the costs of individual sections of route. Railway managers and engineers would need to determine the hierarchy of users on each section of route, and the more complex question of the savings in infrastructure costs that would be achieved by withdrawing different types of traffic. Given that railways have almost always been vertically-integrated in the past, we are more sceptical of the new British approach of vesting the rail infrastructure in a separate company that covers all its costs by charging access fees to railway operators.
Finally, we do not think that rail operators should have free use of infrastructure on the basis of a comparison with roads. Road users make some payments for their use of roads through fuel taxes and annual vehicle licence fees. If these are not thought sufficient to cover the financial and external costs of road traffic, then the appropriate response is to increase user charges for the road network, rather than providing railway infrastructure free in the hope that some road traffic will transfer to rail.
References
Allen, D. and G. Williams (1985): "The Development of Management Information to meet the Needs of a New Management Structure for British Rail". In: K.J. Button and D.E. Pitfield (eds): International Railway Economics. Gower.
Allen, D. (1989): "Management Accounting Developments in British Rail". In: M.W. Pendlebury (ed.): Management Accounting in the Public Sector. Heinemann, Oxford.
Anibarro Garcia, J.J. (1993): European Railway Cost Function: Implication for RENFE Institute for Transport Studies, University of Leeds.
Beesley, M.E. and P.B. Kettle (1985): Improving Railway Financial Performance. Aldershot and Brookfield, Vt.: Gower Press.
British Railways (1978): Measuring Cost and Profitability in British Rail.
Carbajo, J. and G. de Rus (1991): "Railway Transport Policy in Spain". Journal of Transport Economics and Policy, May, 209-214.
Dodgson, J.S. (1979): The Economics of Australian Railway Deficits. Occasional Paper no. 10. Centre for Research on Federal Financial Relations, The Australian National University. Canberra.
Dodgson, J.S. (1977): "Cost-benefit analysis, government policy and the British Railway Network". Transportation 6, 149-170
Dodgson, J.S. (1984): "Railway Costs and Closures". Journal of Transport Economics and Policy, Sept., 219-235.
Dodgson, J.S. (1992): Railway Privatisation. Working Paper No. 66. Department of Economics and Accounting. University of Liverpool. July.
Dodgson, J.S. (1993a): The Economics of BR Privatisation. Paper prepared for the Transport Economists Group Seminar on Rail Privatisation. University of Westminster.
Dodgson, J.S. (1993b): "Access pricing in the railway system". Paper presented to the Conference on Access Pricing in Network Utilities, London Business School, November 12th.
Dodgson, J.S. (1994): "Privatisation and access to the networks". Paper to be presented to the European Conference of Ministers of Transport Seminar "Why do we need railways?", Paris 29th-30th September.
- Ezzamel, M. (1991): "Transfer Pricing" in Ashton, D., T. Hopper and R. W. Scapens (eds): Issues in Management Accounting, Prentice Hall, 61-81.
- Foster, C. D. (1975): The Transport Problem. 2nd edition, Croom Helm, London.
- Gould, J.R. (1964): "Internal Pricing in Firms when there are Costs of Using an Outside Market". The Journal of Business. 61-67.
- Joy, S. (1964): "Railway Track Costs". In D. Munby (ed.): Transport. Penguin. 130-149.
- Joy, S. (1971): "Pricing and Investment in Railway Freight Services". Journal of Transport Economics and Policy 5. (Sept). 1-16.
- Joy, S. (1973): The Train That Ran Away. London: Ian Allen. Chapters 9 and 10.
- Joy, S. (1989): "Railway Costs and Planning". Journal of Transport Economics and Policy, Jan., 45-54
- Ministerio de Transportes Turismo y Comunicaciones (1988): Contrato-Programa Estado-Renfe 1988-1991. Secretaría General Técnica.
- Nash, C.A. (1985): "Paying Subsidy to British Rail: How to get Value for Money". In: Harrison and Gretton (eds.): Transport UK 1985. Newbury, Berks.
- Nash, C.A. (1987): "Social Objectives and Rail Administration". In: Harrison and Gretton (eds.): Transport UK 1987. Newbury, Berks.
- Nash, C.A. (1992): "La política ferroviaria en la Comunidad Europea". In : G. de Rus (ed.): Economía y Política de Transporte: España y Europa. Editorial Civitas and Instituto de Estudios del Transporte y las Comunicaciones.
- Pérez Sanz, J.J. (1992): "Política ferroviaria en España y sintonización con la política comunitaria". In: G. de Rus (ed.): Economía y Política de Transporte: España y Europa. Editorial Civitas and Instituto de Estudios del Transporte y las Comunicaciones.
- Preston, J. (1994) "Does Size Matter? A Case Study of Western European Railways". Paper presented to the Universities Transport Study Group Annual Conference, University of Leeds.
- RENFE (1990): El Nuevo Modelo de Gestión y los Precios de Transferencia. Documento de trabajo. Dirección de Planificación. Noviembre.
Appendix: figures and tables
Figure 1
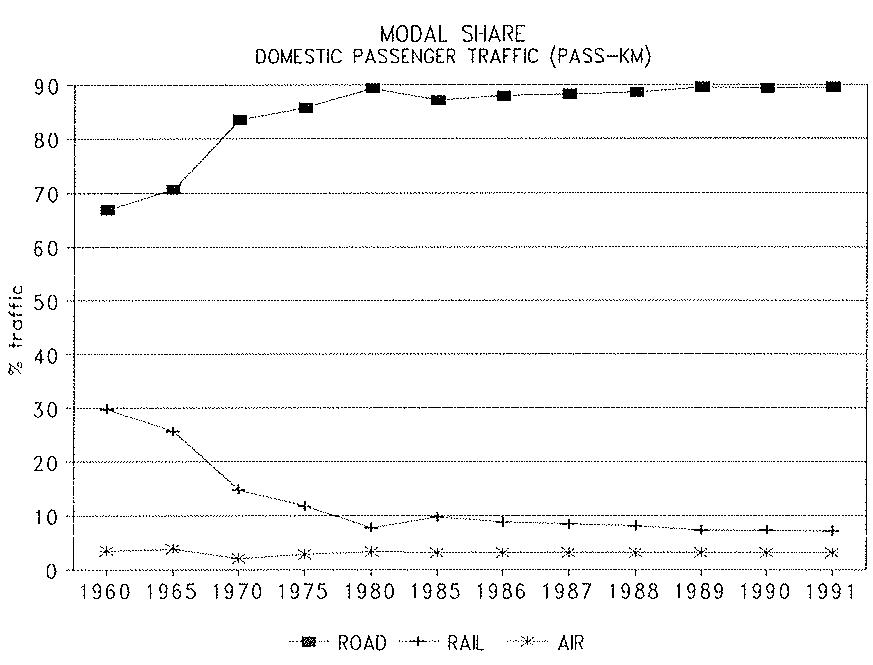
Figure 2
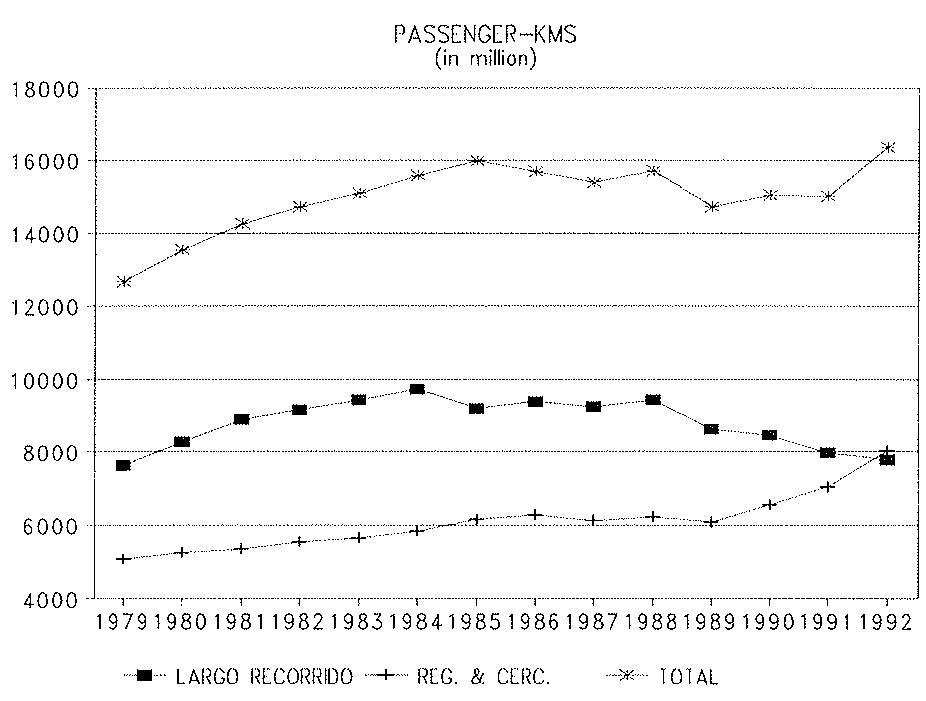
Figure 3
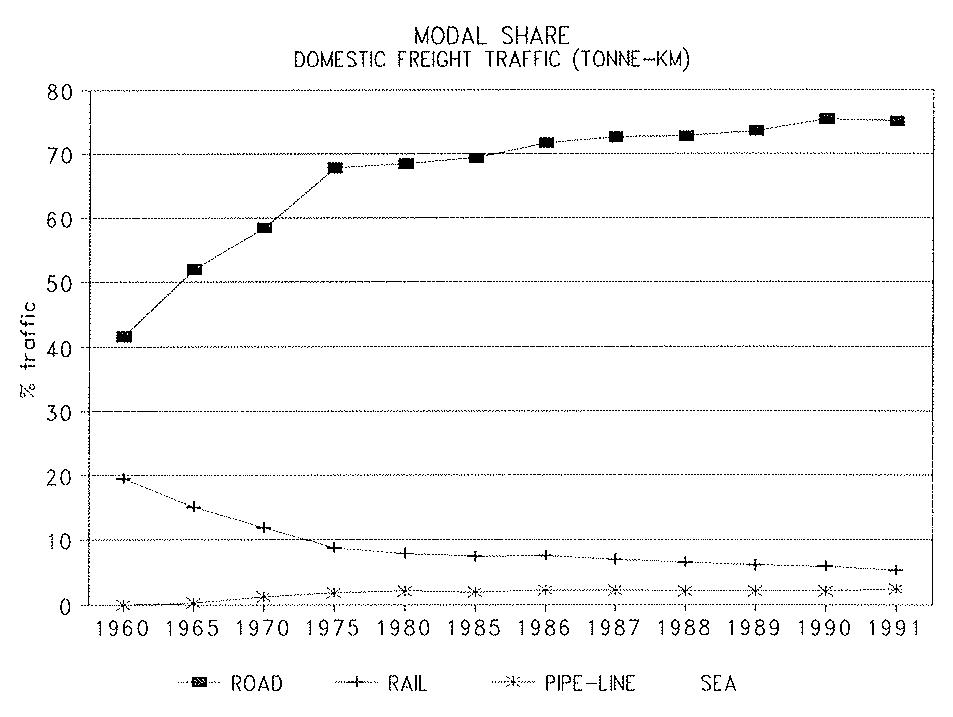
Figure 4
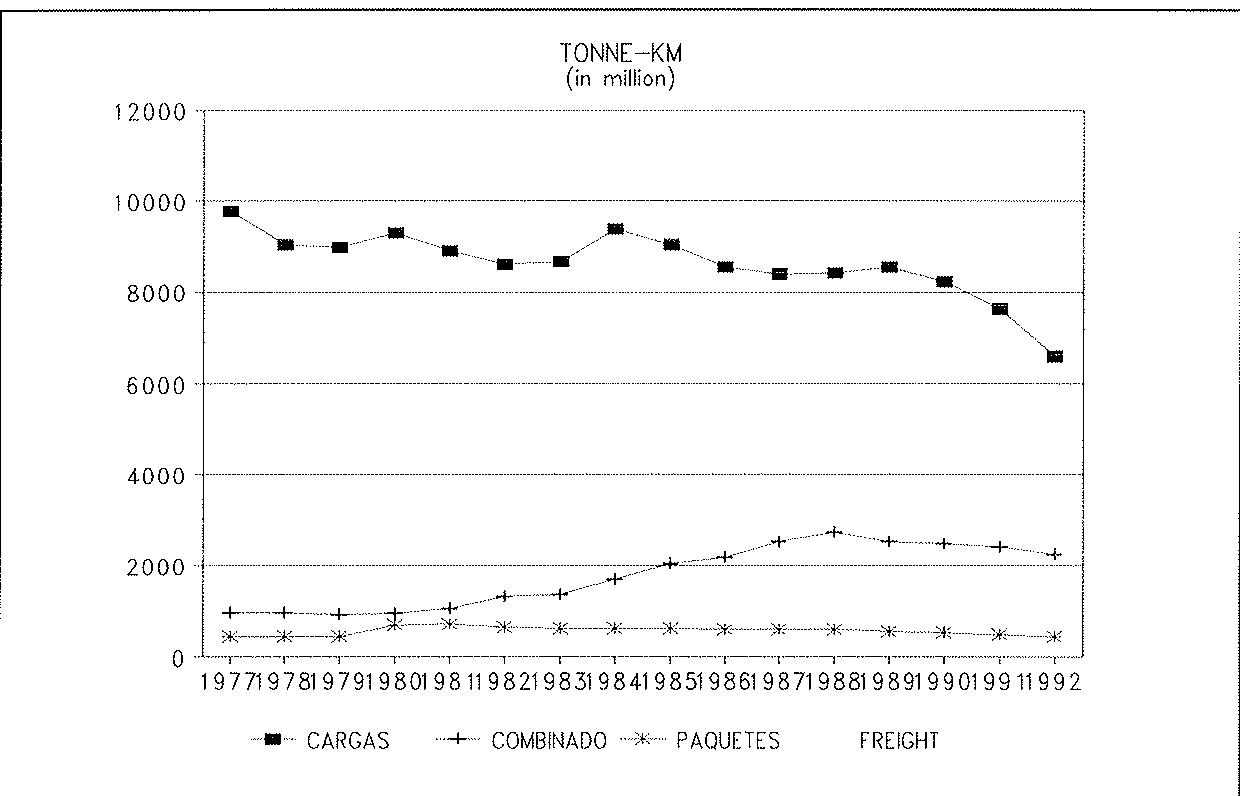
Figure 5
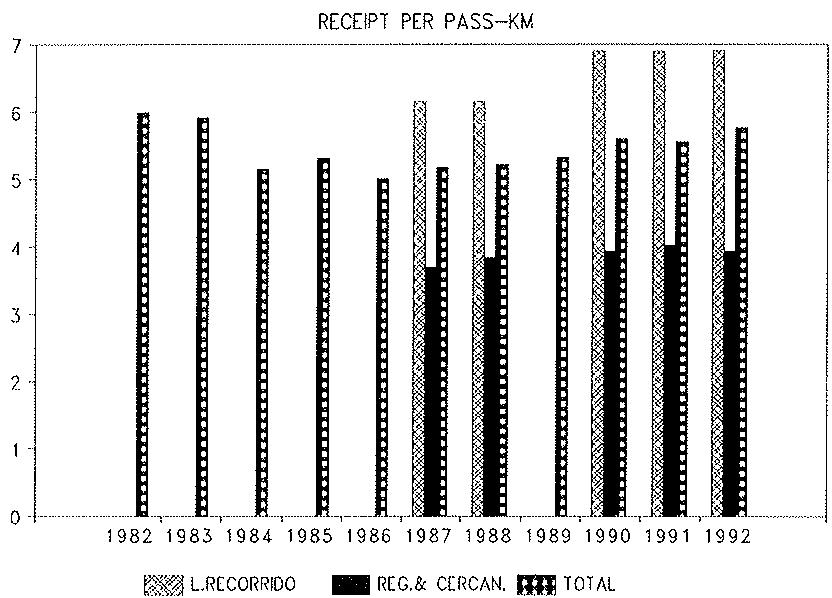
Figure 6
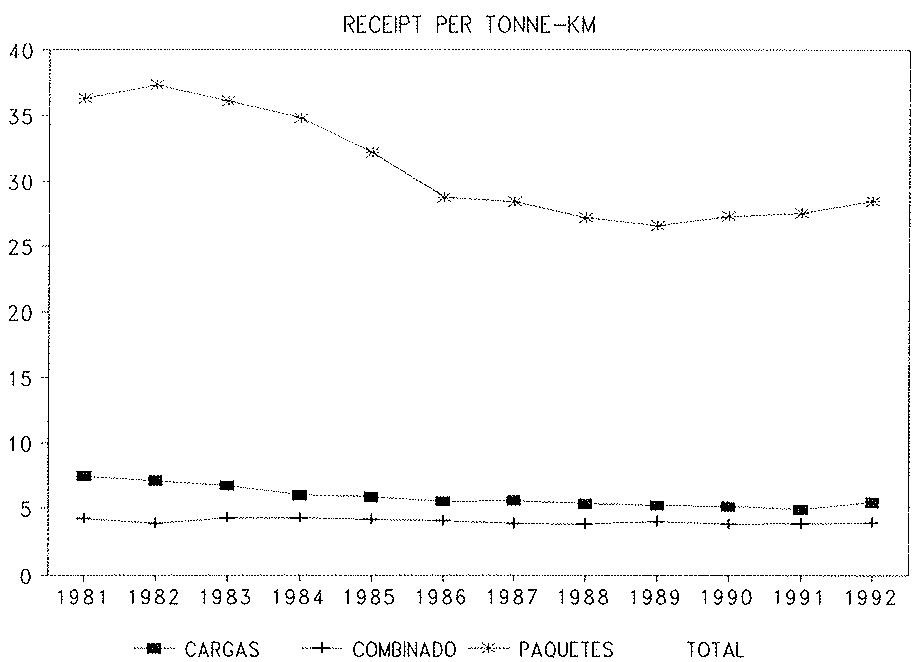
Figure 7
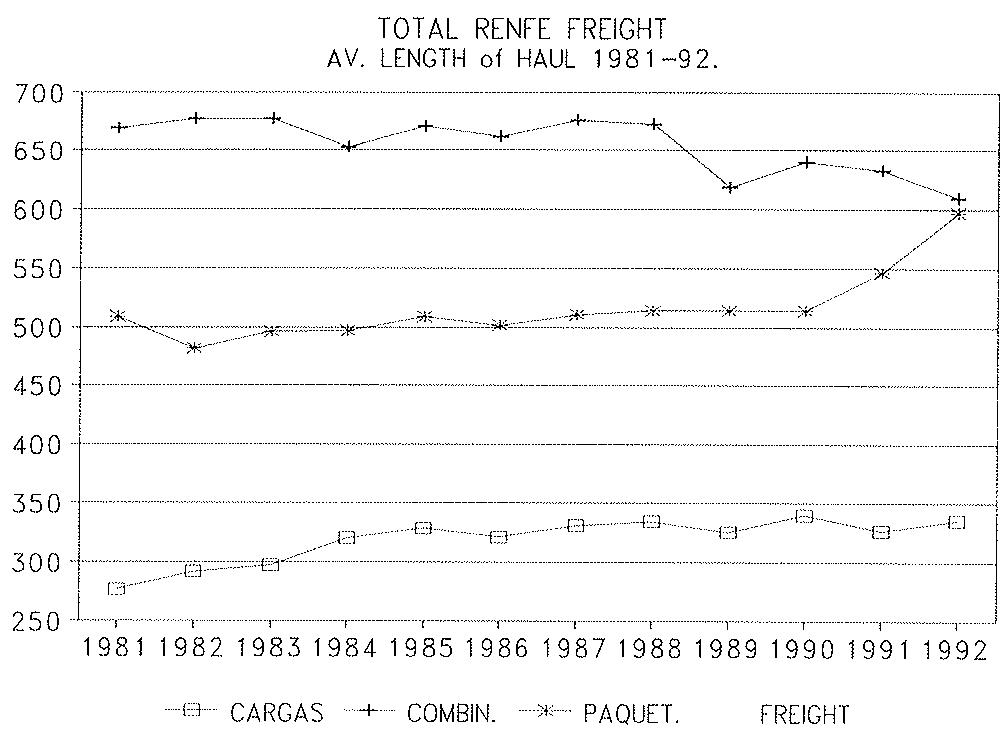
Figure 8
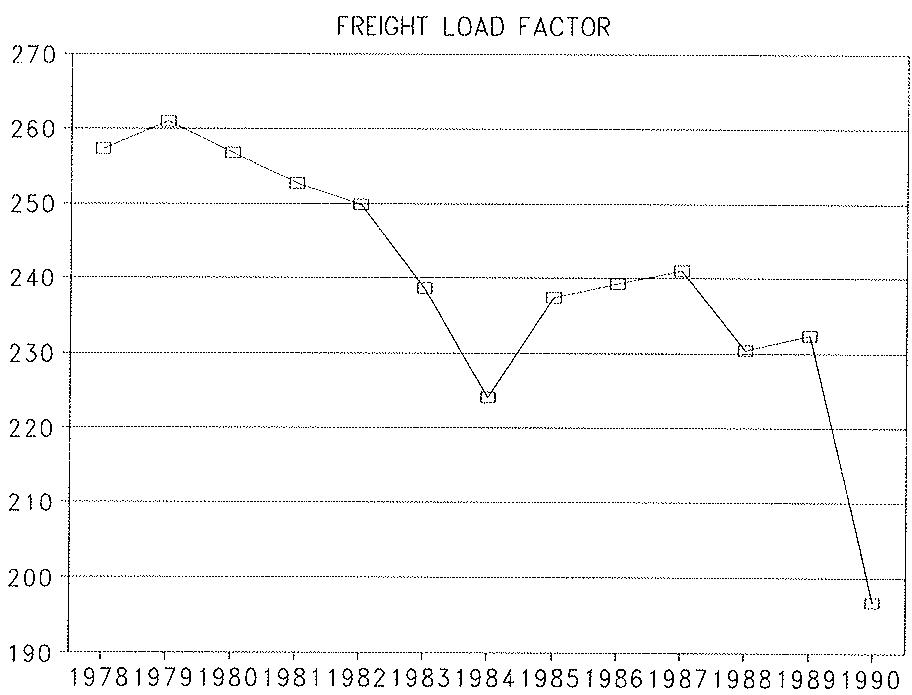
TABLE 1: MODAL SPLIT OF THE DOMESTIC PASSENGER AND FREIGHT TRAFFIC (IN PASSENGER-KM AND TONNES-KM, in million)
| ROAD | RAIL | AIR | SEA | TOTAL | ROAD | RAIL | AIR | SEA | |
| 1960 | 20000 | 8900 | 900 | - | 29800 | 66,9 | 29,7 | 1,34 | - |
| 1965 | 38967 | 13901 | 927 | - | 53785 | 72,4 | 25,9 | 1,70 | - |
| 1970 | 85257 | 14992 | 1966 | - | 102145 | 83,4 | 14,7 | 1,90 | - |
| 1975 | 128946 | 17643 | 3928 | - | 150517 | 85,7 | 11,7 | 2,60 | - |
| 1980 | 165700 | 14047 | 6000 | - | 185747 | 89,2 | 7,56 | 3,23 | - |
| 1985 | 153680 | 17038 | 5216 | 888 | 176822 | 86,91 | 9,64 | 2,95 | 0,5 |
| 1986 | 164986 | 16429 | 5539 | 1001 | 187955 | 87,78 | 8,74 | 2,95 | 0,53 |
| 1987 | 175638 | 16601 | 6028 | 1018 | 199285 | 88,13 | 8,33 | 3,02 | 0,51 |
| 1988 | 186678 | 16888 | 6308 | 1095 | 210969 | 88,49 | 8 | 2,99 | 0,52 |
| 1989 | 197787 | 15999 | 6583 | 1066 | 221435 | 89,32 | 7,23 | 2,97 | 0,48 |
| 1990 | 206905 | 16733 | 7050 | 1057 | 231745 | 89,28 | 7,22 | 3,04 | 0,46 |
| 1991 | 210848 | 16357 | 7234 | 1258 | 235697 | 89,46 | 6,94 | 3,07 | 0,53 |
| ROAD | RAIL | PIPEL. | SEA | AIR | TOTAL | ROAD | RAIL | PIPEL. | SEA | |
| 1960 | 17048 | 7976 | - | 15912 | - | 40936 | 41,6 | 19,5 | - | 38,9 |
| 1965 | 31691 | 9202 | 109 | 19972 | - | 60974 | 52,0 | 15,1 | 0,20 | 32,7 |
| 1970 | 51000 | 10399 | 1023 | 24800 | - | 87222 | 58,5 | 11,8 | 1,20 | 28,5 |
| 1975 | 84533 | 11079 | 2118 | 26870 | 55 | 124725 | 67,81 | 8,89 | 1,70 | 21,56 |
| 1980 | 98898 | 11300 | 3005 | 31125 | 77 | 144402 | 68,50 | 7,82 | 2,08 | 21,55 |
| 1985 | 110500 | 11906 | 3165 | 33694 | 77 | 159342 | 69,35 | 7,47 | 1,99 | 21,15 |
| 1986 | 114000 | 12120 | 3632 | 29388 | 76 | 159216 | 71,6 | 7,61 | 2,28 | 18,46 |
| 1987 | 124600 | 11952 | 3923 | 31136 | 73 | 171684 | 72,58 | 6,96 | 2,29 | 18,14 |
| 1988 | 134900 | 12145 | 3886 | 34439 | 91 | 185461 | 72,74 | 6,55 | 2,1 | 18,57 |
| 1989 | 145000 | 12049 | 4092 | 35988 | 101 | 197230 | 73,52 | 6,11 | 2,07 | 18,25 |
| 1990 | 150000 | 11613 | 4215 | 33043 | 91 | 198962 | 75,39 | 5,84 | 2,12 | 16,61 |
| 1991 | 152250 | 10802 | 4780 | 34853 | 90 | 202775 | 75,08 | 5,33 | 2,36 | 17,19 |
Source: Anuarios Estadisticos. MOPT / Annual reports. RENFE
Source. Annual Reports. Management Reports 1991, 1992. RENFE TABLE 2. PASSENGER JOURNEYS AND FREIGHT TONNES (thousands) FEDEA- D.T. 95-15 by J. Dodgson and P. Rodríguez
| PASSENGER | FULL LOADS | COMBINED | PARCELS | FREIGHT | |||||||||||
| YEAR | AVE. | LARGO RECORRID | REGIONAL | CERCA NIAS | REG. & CERC. | TOTAL | FULL WAGON | INTERNAL TRANSP. | TOTAL | LOADS | CARGOEXP. | PAQUEXP. | CORREOS | TOTAL | TOTAL |
| 1970 | 0 | N.A. | N.A. | N.A. | N.A. | 125478 | N.A. | N.A. | N.A. | N.A. | N.A. | N.A. | N.A. | N.A. | 30898 |
| 1971 | 0 | N.A. | N.A. | N.A. | N.A. | 127008 | N.A. | N.A. | N.A. | N.A. | N.A. | N.A. | N.A. | N.A. | 32107 |
| 1972 | 0 | N.A. | N.A. | N.A. | N.A. | 136189 | N.A. | N.A. | N.A. | N.A. | N.A. | N.A. | N.A. | N.A. | 34545 |
| 1973 | 0 | N.A. | N.A. | N.A. | N.A. | 147666 | N.A. | N.A. | N.A. | N.A. | N.A. | N.A. | N.A. | N.A. | 37621 |
| 1974 | 0 | N.A. | N.A. | N.A. | N.A. | 152256 | N.A. | N.A. | N.A. | N.A. | N.A. | N.A. | N.A. | N.A. | 39667 |
| 1975 | 0 | N.A. | N.A. | N.A. | N.A. | 153021 | N.A. | N.A. | N.A. | N.A. | N.A. | N.A. | N.A. | N.A. | 37672 |
| 1976 | 0 | N.A. | N.A. | N.A. | N.A. | 157828 | N.A. | N.A. | N.A. | N.A. | N.A. | N.A. | N.A. | N.A. | 36031 |
| 1977 | 0 | N.A. | N.A. | N.A. | N.A. | 162356 | 31831,5 | 1511, | 33343,3 | 1135 | 1779,8 | 138,1 | 868,5 | 2786,4 | 37465 |
| 1978 | 0 | N.A. | N.A. | N.A. | N.A. | 158454 | 30178,6 | 1855,1 | 32033,7 | 1348,5 | 1403,5 | 151 | 856,2 | 2410,7 | 35823 |
| 1979 | 0 | N.A. | N.A. | N.A. | N.A. | 157000 | 30375,7 | 1744,3 | 32120 | 1343 | 1298,3 | 157,2 | 858,5 | 2314 | 35750 |
| 1980 | 0 | N.A. | N.A. | N.A. | N.A. | 167200 | N.A. | N.A. | N.A. | N.A. | N.A. | N.A. | N.A. | N.A. | 36529 |
| 1981 | 0 | N.A. | N.A. | N.A. | N.A. | 176300 | 29245,2 | 2938,6 | 32183,8 | 1578,1 | 382,4 | 144,7 | 844,2 | 1371,3 | 35133 |
| 1982 | 0 | N.A. | N.A. | N.A. | N.A. | 181700 | 26847,3 | 2534,7 | 29382 | 1901,8 | 362,2 | 148,2 | 799,3 | 1309,7 | 32594 |
| 1983 | 0 | N.A. | N.A. | N.A. | N.A. | 186600 | 26030,7 | 3053,7 | 29084,4 | 1985,2 | 349 | 142 | 733,8 | 1224,8 | 32294,4 |
| 1984 | 0 | N.A. | N.A. | N.A. | N.A. | 193100 | 26776,7 | 2476,2 | 29252,9 | 2576 | 355,1 | 141,7 | 709,5 | 1206,3 | 33015,2 |
| 1985 | 0 | N.A. | N.A. | N.A. | N.A. | 197050 | 25291,7 | 2164,8 | 27456,5 | 3023 | 338,3 | 130,8 | 733,9 | 1203 | 31682,5 |
| 1986 | 0 | N.A. | N.A. | N.A. | N.A. | 184500 | 24463,3 | 2124,8 | 26587,6 | 3267,5 | 321,1 | 116,2 | 734,8 | 1172,1 | 31027,2 |
| 1987 | 0 | N.A. | N.A. | N.A. | N.A. | 189700 | 23405,7 | 1883,5 | 25289,2 | 3734 | 316,3 | 112,5 | 710,5 | 1139,3 | 30162,5 |
| 1988 | 0 | N.A. | N.A. | N.A. | N.A. | 194100 | 22741,5 | 2364,3 | 25105,8 | 4049,1 | 316,9 | 113,4 | 716,9 | 1147,2 | 30302 |
| 1989 | 0 | N.A. | N.A. | N.A. | N.A. | 181600 | 23619,9 | 2567 | 26186,9 | 4073,7 | 257,5 | 102,3 | 708,9 | 1068,7 | 31329 |
| 1990 | 0 | 16600 | 22000 | 225400 | 247400 | 264000 | 21581 | 2593 | 24174 | 3865 | 217 | 114 | 688 | 1019 | 29057 |
| 1991 | 0 | 15717 | 21110 | 279496 | 300606 | 316323 | 20649 | 2688 | 23337 | 3783 | 180 | 116 | 587 | 883 | 28003 |
| 1992 | 1314 | 15035 | 22985 | 319274 | 342259 | 358608 | 18031,8 | 1594,1 | 19625,9 | 3687 | 201,6 | 130,8 | 361,6 | 694 | 24597 |
TABLE 3: CARGAS COMPLETAS (FULL LOADS) TONNES (BY TYPE OF PRODUCT) FEDEA- D.T. 95-15 by J. Dodgson and P. Rodríguez
| CEREAL | COAL | TIMBER | CEMENT | LIME | MINE | IRON & STEEL | FLAMABL LIQ. | CHEMICALS | PROPANE BUTANE | FERTILISERS | MOTOR NATION . | MILITAR | FRUIT | MOTOR INTERN. | OTHER INTERN . | |
| 1970 | N.A. | N.A. | N.A. | N.A. | N.A. | N.A. | N.A. | N.A. | N.A. | N.A. | N.A. | N.A. | N.A. | N.A. | N.A. | N.A. |
| 1971 | N.A. | N.A. | N.A. | N.A. | N.A. | N.A. | N.A. | N.A. | N.A. | N.A. | N.A. | N.A. | N.A. | N.A. | N.A. | N.A. |
| 1972 | N.A. | N.A. | N.A. | N.A. | N.A. | N.A. | N.A. | N.A. | N.A. | N.A. | N.A. | N.A. | N.A. | N.A. | N.A. | N.A. |
| 1973 | N.A. | N.A. | N.A. | N.A. | N.A. | N.A. | N.A. | N.A. | N.A. | N.A. | N.A. | N.A. | N.A. | N.A. | N.A. | N.A. |
| 1974 | N.A. | N.A. | N.A. | N.A. | N.A. | N.A. | N.A. | N.A. | N.A. | N.A. | N.A. | N.A. | N.A. | N.A. | N.A. | N.A. |
| 1975 | N.A. | N.A. | N.A. | N.A. | N.A. | N.A. | N.A. | N.A. | N.A. | N.A. | N.A. | N.A. | N.A. | N.A. | N.A. | N.A. |
| 1976 | N.A. | N.A. | N.A. | N.A. | N.A. | N.A. | N.A. | N.A. | N.A. | N.A. | N.A. | N.A. | N.A. | N.A. | N.A. | N.A. |
| 1977 | 1423 | 2547 | N.A. | 3086 | 6940 | 2906 | 6765 | 575 | 527 | 1301 | 440 | N.A. | 1152 | N.A. | N.A. | |
| 1978 | 1244 | 2117 | N.A. | 3929 | 6829 | 2511 | 6566 | 609 | 533 | 1253 | 454 | N.A. | 1103 | N.A. | N.A. | |
| 1979 | 1419 | 1911 | N.A. | 4065 | 7229 | 2254 | 5975 | 624 | 609 | 1286 | 425 | N.A. | 1013 | N.A. | N.A. | |
| 1980 | 1390 | 2981 | N.A. | 3333 | 7012 | 2502 | 6035 | 686 | 591 | 1196 | 412 | N.A. | N.A. | N.A. | N.A. | |
| 1981 | 1504 | 3962 | 316 | 3119 | 6638 | 2121 | 4959 | 711 | 562 | 1112 | 249 | 153 | 899 | N.A. | N.A. | |
| 1982 | 1587 | 3669 | 319 | 3529 | 5745 | 2151 | 3369 | 740 | 513 | 1031 | 233 | 157 | 817 | N.A. | N.A. | |
| 1983 | 1715 | 3328 | 389 | 3126 | 5724 | 2521 | 2440 | 753 | 525 | 1071 | 298 | 174 | 851 | N.A. | 1356 | |
| 1984 | 1756 | 3440 | 679 | 2767 | 5983 | 2691 | 1850 | 905 | 519 | 1266 | 333 | 154 | 1042 | N.A. | 1584 | |
| 1985 | 2024 | 2597 | 690 | 2867 | 5270 | 2846 | 1739 | 971 | 506 | 1148 | 336 | 157 | 671 | N.A. | 1680 | |
| 1986 | 1846 | 3052 | 550 | 2559 | 4877 | 2737 | 1750 | 1001 | 505 | 1148 | 327 | 96 | 644 | N.A. | 1526 | |
| 1987 | 1542 | 2692 | 550 | 1035 | 1561 | 3846 | 2970 | 1976 | 1043 | 459 | 1038 | 426 | 119 | 527 | N.A. | 1797 |
| 1988 | 1519 | 2388 | 559 | 1035 | 1381 | 3190 | 3144 | 1814 | 1029 | 551 | 899 | 396 | 155 | 339 | N.A. | 2103 |
| 1989 | 1159 | 2522 | 671 | 1029 | 1613 | 3721 | 3167 | 1819 | 1013 | 621 | 859 | 426 | 162 | 231 | 275 | 2149 |
| 1990 | 1201 | 2190 | 623 | 1057 | 1564 | 2495 | 3008 | 1650 | 1012 | 723 | 717 | 366 | 135 | 202 | 352 | 1982 |
| 1991 | 1025 | 2259 | 613 | 1130 | 1544 | 3140 | 2717 | 1138 | 884 | 701 | 705 | 353 | 72 | 150 | 384 | 2116 |
| 1992 | 929 | 2034 | 524 | 1162 | 1086 | 2395 | 2500 | 896 | 838 | 621 | 488 | 402 | 60 | 167 | 378 | 1821 |
Note: (.) Denotes that before 1979 the figures were calculated by a different method than the current one, and they are inconsistent with later results FEDEA- D.T. 95-15 by J. Dodgson and P. Rodríguez TABLE 4: PASSENGER-KMS AND TONNE-KMS (millions)
| PASSENGERS | CARGAS COMPLETAS | COMBINADO | PAQUETERIA | FREIGHT | |||||||||||
| AVE | L.RECORRIDO | REGIONAL | CERCANIAS | REG. & CERCANIAS | TOTAL | FULL WAGON | INTERNAL TRANSPORT | TOTAL | TOTAL | CARGO EXPRESS | PAQUETE EXPRESS | CORREOS | TOTAL | TOTAL | |
| 1970 | 0 | 7003 | N.A. | N.A. | N.A. | (13293) | N.A. | N.A. | N.A. | N.A. | N.A. | N.A. | N.A. | N.A. | 9693 |
| 1971 | 0 | N.A. | N.A. | N.A. | N.A. | (13467) | N.A. | N.A. | N.A. | N.A. | N.A. | N.A. | N.A. | N.A. | 9523 |
| 1972 | 0 | N.A. | N.A. | N.A. | N.A. | (14391) | N.A. | N.A. | N.A. | N.A. | N.A. | N.A. | N.A. | N.A. | 10221 |
| 1973 | 0 | N.A. | N.A. | N.A. | N.A. | (15640) | N.A. | N.A. | N.A. | N.A. | N.A. | N.A. | N.A. | N.A. | 11561 |
| 1974 | 0 | N.A. | N.A. | N.A. | N.A. | (16079) | N.A. | N.A. | N.A. | N.A. | N.A. | N.A. | N.A. | N.A. | 11577 |
| 1975 | 0 | 8497 | N.A. | N.A. | N.A. | (16146) | N.A. | N.A. | N.A. | N.A. | N.A. | N.A. | N.A. | N.A. | 10693 |
| 1976 | 0 | N.A. | N.A. | N.A. | N.A. | (16686) | N.A. | N.A. | N.A. | N.A. | N.A. | N.A. | N.A. | N.A. | 10766 |
| 1977 | 0 | N.A. | N.A. | N.A. | N.A. | (17163) | 9350,1 | 400,3 | 9750,4 | 956,1 | 286,5 | 60.8 | 371,5 | 432,3 | 11425 |
| 1978 | 0 | N.A. | N.A. | N.A. | N.A. | (16578) | 8688,7 | 331 | 9019,7 | 962,3 | 295,5 | 66,5 | 364 | 430,5 | 10708 |
| 1979 | 0 | 7623 | N.A. | N.A. | 5048 | 12671 | 8628,3 | 329,5 | 8957,8 | 904,7 | 295,2 | 69,2 | 364,7 | 433,9 | 10592 |
| 1980 | 0 | 8287 | N.A. | N.A. | 5240 | 13527 | 8663,8 | 609,7 | 9273,5 | 931 | 322,5 | 360,4 | 682,9 | 10887,3 | |
| 1981 | 0 | 8897 | N.A. | N.A. | 5364 | 14261 | 8370,7 | 513,5 | 8884,2 | 1056,1 | 273,1 | 63,6 | 361,9 | 698,6 | 10603 |
| 1982 | 0 | 9151 | N.A. | N.A. | 5552 | 14703 | 8119,3 | 465,7 | 8585 | 1287,8 | 224,6 | 65,1 | 341,3 | 631 | 10503,8 |
| 1983 | 0 | 9437 | N.A. | N.A. | 5655 | 15092 | 8118,5 | 529,4 | 8647,9 | 1343,1 | 216,2 | 63 | 328,5 | 607,7 | 10598,7 |
| 1984 | 0 | 9730 | N.A. | N.A. | 5844 | 15574 | 8956,4 | 406,3 | 9362,7 | 1682,6 | 207,5 | 62,8 | 329,4 | 599,7 | 11654 |
| 1985 | 0 | 9186 | N.A. | N.A. | 6163 | 15979 | 8676,9 | 335,2 | 9015,1 | 2029,2 | 209,7 | 57,2 | 345,6 | 612,5 | 11653,8 |
| 1986 | 0 | 9387 | N.A. | N.A. | 6306 | 15693 | 8232,9 | 307,5 | 8540,4 | 2163,6 | 199,3 | 47,5 | 340,9 | 587,7 | 11291,7 |
| 1987 | 0 | 9251 | 2903 | 3240 | 6143 | 15394 | 8066,4 | 303,2 | 8369,6 | 2524,6 | 195,9 | 49,5 | 335,2 | 580,6 | 11474,8 |
| 1988 | 0 | 9432 | 2364 | 3870 | 6234 | 15716 | 7972,6 | 428,6 | 8401,2 | 2724,4 | 196,4 | 50,9 | 342,9 | 590,2 | 11715,8 |
| 1989 | 0 | 8627 | 2323 | 3765 | 6088 | 14715 | 8086,7 | 460 | 8546,7 | 2522,6 | 159 | 46,9 | 343,4 | 549,3 | 11618,6 |
| 1990 | 0 | 8455 | 1975 | 4595 | 6570 | 15025 | 7745 | 464 | 8209 | 2473 | 134 | 53 | 337 | 524 | 11206 |
| 1991 | 0 | 7991 | 1900 | 5131 | 7031 | 15022 | 7146 | 485 | 7631 | 2395 | 111 | 53 | 318 | 482 | 10507 |
| 1992 | 513 | 7793 | 2154 | 5890 | 8044 | 16350 | 6302,6 | 286,7 | 6589,3 | 2249,4 | 125,5 | 60,2 | 227,9 | 414 | 9361 |
Source. Annual Reports. Management Reports 1991, 1992. RENFE FEDEA- D.T. 95-15 by J. Dodgson and P. Rodríguez TABLE 5: CARGAS COMPLETAS TONNE-KMS (BY TYPE OF PRODUCT)
| CEREAL | COAL | TIMBER | CEMENT | LIME STONES | MINERALS | IRON & STEEL | FLAMABLE LIQUIDS | CHEMI CHALS | PROPANE BUTANE | FERTILI SERS | MOTOR NATION . | MILITAR | FRUIT | MOTOR INTERN. | OTHER INTERN. | |
| 1970 | N.A. | N.A. | N.A. | N.A. | N.A. | N.A. | N.A. | N.A. | N.A. | N.A. | N.A. | N.A. | N.A. | N.A. | N.A. | N.A. |
| 1971 | N.A. | N.A. | N.A. | N.A. | N.A. | N.A. | N.A. | N.A. | N.A. | N.A. | N.A. | N.A. | N.A. | N.A. | N.A. | N.A. |
| 1972 | N.A. | N.A. | N.A. | N.A. | N.A. | N.A. | N.A. | N.A. | N.A. | N.A. | N.A. | N.A. | N.A. | N.A. | N.A. | N.A. |
| 1973 | N.A. | N.A. | N.A. | N.A. | N.A. | N.A. | N.A. | N.A. | N.A. | N.A. | N.A. | N.A. | N.A. | N.A. | N.A. | N.A. |
| 1974 | N.A. | N.A. | N.A. | N.A. | N.A. | N.A. | N.A. | N.A. | N.A. | N.A. | N.A. | N.A. | N.A. | N.A. | N.A. | N.A. |
| 1975 | N.A. | N.A. | N.A. | N.A. | N.A. | N.A. | N.A. | N.A. | N.A. | N.A. | N.A. | N.A. | N.A. | N.A. | N.A. | N.A. |
| 1976 | N.A. | N.A. | N.A. | N.A. | N.A. | N.A. | N.A. | N.A. | N.A. | N.A. | N.A. | N.A. | N.A. | N.A. | N.A. | N.A. |
| 1977 | 734 | 404 | N.A. | 443 | 1144 | 1286 | 1440 | 336 | 244 | 458 | 233 | N.A. | 773 | N.A. | N.A. | |
| 1978 | 612 | 298 | N.A. | 488 | 959 | 1081 | 1444 | 418 | 224 | 466 | 222 | N.A. | 761 | N.A. | N.A. | |
| 1979 | 632 | 243 | N.A. | 458 | 1025 | 1085 | 1298 | 445 | 230 | 461 | 220 | N.A. | 683 | N.A. | N.A. | |
| 1980 | 657,2 | 379 | N.A. | 375,5 | 994 | 1148 | 1311 | 489,5 | 223 | 429 | 213,4 | N.A. | N.A. | N.A. | N.A. | |
| 1981 | 679,2 | 807,4 | 296 | 336,8 | 970 | 997,6 | 998 | 551,4 | 211,5 | 435,2 | 189,5 | N.A. | 596,8 | 646,5 | ||
| 1982 | 659,8 | 908 | 301,7 | 326,1 | 799,2 | 1114,8 | 792,7 | 587,5 | 198,1 | 433,1 | 191 | N.A. | 544,1 | 647 | ||
| 1983 | 821 | 832 | 342 | 278 | 762 | 1227 | 522 | 597 | 205 | 464 | 157 | 74 | 561 | 616 | ||
| 1984 | 1019 | 758 | 550 | 244 | 795 | 1350 | 435 | 679 | 203 | 612 | 180 | 67 | 687 | 725 | ||
| 1985 | 1107 | 497 | 606 | 254 | 667 | 1422 | 432 | 666 | 189 | 633 | 180 | 68 | 445 | 811 | ||
| 1986 | 1046,6 | 573,3 | 445,4 | 193,6 | 51,4 | 623,5 | 1393,1 | 443,1 | 597,8 | 171,5 | 600,9 | 188,8 | 39,1 | 427 | 754 | |
| 1987 | 846 | 571 | 413 | 197 | 70 | 412 | 1526 | 518 | 614 | 148 | 508 | 267 | 46 | 354 | 843 | |
| 1988 | 800 | 516 | 422 | 195 | 60 | 338 | 1633 | 388 | 588 | 187 | 436 | 250 | 73 | 224 | 987 | |
| 1989 | 613 | 576 | 490 | 209 | 73 | 403 | 1778 | 386 | 571 | 214 | 395 | 265 | 80 | 153 | 1103 | |
| 1990 | 641 | 523 | 447 | 224 | 72 | 253 | 1582 | 397 | 606 | 248 | 314 | 232 | 73 | 121 | 184 | 6 |
| 1991 | 492 | 506 | 513 | 240 | 73 | 310 | 1407 | 336 | 560 | 262 | 316 | 213 | 38 | 91 | 189 | |
| 1992 | 422 | 397 | 431 | 240 | 46 | 234 | 1277 | 296 | 510 | 256 | 225 | 241 | 31 | 95 | 179 | 850 |
TABLE 6:. PASSENGERS IN CERCANIAS
| Cercanías: number of passenger (million) | |||||
| 1990 | 1991 | 1992 | %90/91 | % 91/92 | |
| Madrid | 109,3 | 144,6 | 172,41 | 32,3 | 19,2 |
| Barcelona | 53,37 | 63,83 | 72,56 | 19,6 | 13,7 |
| Bilbao | 23,89 | 26,08 | 24,48 | 9,2 | -6,1 |
| Valencia | 11,35 | 14,48 | 17,35 | 27,6 | 19,8 |
| Asturias | 4,61 | 5,07 | 5,48 | 10 | 8,1 |
| Málaga | 10,04 | 10,07 | 7,53 | 0,3 | -25,2 |
| Sevilla | 3,81 | 3,18 | 6,14 | -16,5 | 93,1 |
| San Sebastián | 4,83 | 6,8 | 7,28 | 40,8 | 7,1 |
| Murcia | 2,19 | 2,54 | 3,07 | 16 | 20,9 |
| Cádiz | 0,78 | 1,25 | 1,71 | 60,3 | 36,8 |
| Santander | 0,98 | 1,02 | 1,01 | 4,1 | -1 |
| Tarragona | 0,3 | 0,54 | 0,16 | 80 | -70,4 |
| 9 centres | 38,89 | 44,95 | 49,73 | 15,6 | 10,6 |
Source: 100 datos estadisticos 1990-91-92. RENFE. NOTE: 9 centres means all centres apart from Madrid, Barcelona and Bilbao.
TABLE 7: MAIN CORRIDORS OF LARGO RECORRIDO.
| Largo Recorrido: passenger-km (million) | |||||
| 1990 | 1991 | % 90/91 | 1992 | % 91/92 | |
| Madrid-Cornisa Cantábrica | 1004,1 | 898,6 | -10,5 | 834,3 | -7,2 |
| Madrid-Zaragoza/Barcelona | 946,6 | 889,7 | -6 | 813,1 | -8,6 |
| Madrid-Valencia/Alicante/Murcia | 703,9 | 739,8 | 5,1 | 745,8 | 0,8 |
| Madrid-Andalucía/Extremadura | 1210,5 | 1133,2 | -6,4 | 986,1 | -13 |
| Transversal Estrella | 1134 | 1100,7 | -2,9 | 1094,4 | -0,6 |
| Transversal Mediterráneo | 1217,3 | 1264 | 3,8 | 1570,5 | 24,2 |
| Internacional | 483,7 | 454,7 | -6 | 466 | 2,5 |
Source: 100 datos estadisticos 1990-1991-92. RENFE
TABLE 8. PASSENGER-KM IN LARGO RECORRIDO BY TYPE OF TRAIN
| 1980 | 1984 | 1985 | 1986 | 1987 | 1988 | 1989 | 1990 | 1991 | 1992 | |
| Rápidos y Expresos | 5940 | 7063 | 7270 | 6952 | 7100 | 7004 | 5927 | 5251 | 4715 | 4389 |
| Talgo | 938 | 1324 | 1338 | 1381 | 1475 | 1572 | 1661 | 2121 | 2213 | 2375 |
| Electrotrén | 601 | 690 | 685 | 615 | 666 | 856 | 1039 | 1083 | 1063 | 1029 |
Source: Annual Reports. 100 datos estadisticos 1990-91-92. RENFE.
Source: Annual Reports. Management Reports 1991,1992. RENFE FEDEA - D.T. 94-15 by J. Dodgson and P. Rodríguez TABLE 9: REVENUE AT CURRENT PRICES.
| PASSENGER | CARGAS COMPLETAS | COMBINAD | FREIGHT | FREIGHT | |||||||||||
| AVE | L.RECORR. | REGION. | CERCANÍAS | REG. & CERCAN | TOTAL | COMPLETE WAGON | INTERNAL TRANSPOR | TOTAL | TOTAL | CARGO EXPRESS | PAQUETE EXPRESS | CORREOS | TOTAL PARCELS | TOTAL | |
| 1970 | 0 | N.A. | N.A. | N.A. | N.A. | N.A. | N.A. | N.A. | N.A. | N.A. | N.A. | N.A. | N.A. | N.A. | N.A. |
| 1971 | 0 | N.A. | N.A. | N.A. | N.A. | N.A. | N.A. | N.A. | N.A. | N.A. | N.A. | N.A. | N.A. | N.A. | N.A. |
| 1972 | 0 | N.A. | N.A. | N.A. | N.A. | N.A. | N.A. | N.A. | N.A. | N.A. | N.A. | N.A. | N.A. | N.A. | N.A. |
| 1973 | 0 | N.A. | N.A. | N.A. | N.A. | N.A. | N.A. | N.A. | N.A. | N.A. | N.A. | N.A. | N.A. | N.A. | N.A. |
| 1974 | 0 | N.A. | N.A. | N.A. | N.A. | N.A. | N.A. | N.A. | N.A. | N.A. | N.A. | N.A. | N.A. | N.A. | N.A. |
| 1975 | 0 | N.A. | N.A. | N.A. | N.A. | N.A. | N.A. | N.A. | N.A. | N.A. | N.A. | N.A. | N.A. | N.A. | N.A. |
| 1976 | 0 | N.A. | N.A. | N.A. | N.A. | 18357 | 14040 | N.A. | N.A. | 558 | N.A. | N.A. | 1836 | N.A. | N.A. |
| 1977 | 0 | N.A. | N.A. | N.A. | N.A. | 21378 | 17193 | N.A. | N.A. | 698 | N.A. | N.A. | 2270 | N.A. | N.A. |
| 1978 | 0 | N.A. | N.A. | N.A. | N.A. | N.A. | N.A. | N.A. | N.A. | N.A. | N.A. | N.A. | 3060 | N.A. | N.A. |
| 1979 | 0 | N.A. | N.A. | N.A. | N.A. | N.A. | N.A. | N.A. | N.A. | N.A. | N.A. | N.A. | 3746 | N.A. | N.A. |
| 1980 | 0 | N.A. | N.A. | N.A. | N.A. | N.A. | N.A. | N.A. | N.A. | N.A. | N.A. | N.A. | 4474 | N.A. | N.A. |
| 1981 | 0 | N.A. | N.A. | N.A. | N.A. | N.A. | 24917 | 2994 | 27911 | 1870 | 6044 | 4594 | 10638 | 40419 | |
| 1982 | 0 | N.A. | N.A. | N.A. | N.A. | 42228 | 26340 | 3009 | 29349 | 2395 | 6890 | 4426 | 11316 | 43060 | |
| 1983 | 0 | N.A. | N.A. | N.A. | N.A. | 48069 | 27088 | 4296 | 31384 | 3083 | 6910 | 4900 | 11810 | 46277 | |
| 1984 | 0 | N.A. | N.A. | N.A. | N.A. | 48046 | 30007 | 3679 | 33677 | 4305 | 6808 | 5687 | 12497 | 50479 | |
| 1985 | 0 | N.A. | N.A. | N.A. | N.A. | 55307 | 31633 | 2924 | 34557 | 5476 | 6860 | 6005 | 12865 | 52898 | |
| 1986 | 0 | N.A. | N.A. | N.A. | N.A. | 55761 | 30593 | 3073 | 33666 | 6219 | 5936 | 6076 | 12012 | 51897 | |
| 1987 | 0 | 42513 | N.A. | N.A. | 16940 | 59453 | 31906 | 2896 | 34802 | 7307 | 5809 | 6513 | 12322 | 54431 | |
| 1988 | 0 | 45403 | N.A. | N.A. | 18704 | 64107 | 32350 | 3117 | 35467 | 8008 | 5939 | 6597 | 12536 | 56011 | |
| 1989 | 0 | N.A. | N.A. | N.A. | N.A. | 65537 | 33971 | 3194 | 37165 | 8485 | 2590 | 2883 | 6732 | 12207 | 58773 |
| 1990 | 0 | 51976 | 8100 | 14965 | 23065 | 75041 | 34275 | 3425 | 37700 | 8303 | 2208 | 3351 | 7211 | 12770 | 58773 |
| 1991 | 0 | 51960 | 8203 | 18586 | 26789 | 78749 | 32086 | 3638 | 35724 | 8690 | 1918 | 3451 | 7119 | 12542 | 56864 |
| 1992 | 8440 | 53864 | 9303 | 22329 | 31632 | 93936 | 35727 | 35727 | 8812 | 11719 | 11779 | 53403 | |||
TABLE 10. REVENUE AT 1992 PRICES. (million ptas) FEDEA - D.T. 94-15 by J. Dodgson and P. Rodríguez
| PASSENGER | CARGAS COMPLETAS | COMBINADO | PAQUETERIA | FREIGHT TOTAL | |||||||||||
| AVE | L.RECORR | REGION. | CERCANIAS | REG. & CERCANIAS | TOTAL | FULL WAGON | INTERNAL TRANSPORTS | TOTAL | TOTAL | CARGO EXPRESS | PAQUETE EXPRESS | CORREOS | TOTAL | ||
| 1976 | 0 | NA | NA | NA | NA | 99820 | 76345 | NA | NA | 3034 | NA | NA | 9984 | NA | NA |
| 1977 | 0 | NA | NA | NA | NA | 93371 | 75092 | NA | NA | 3049 | NA | NA | 9914 | NA | NA |
| 1978 | 0 | NA | NA | NA | NA | NA | NA | NA | NA | NA | NA | NA | 11156 | NA | NA |
| 1979 | 0 | NA | NA | NA | NA | NA | NA | NA | NA | NA | NA | NA | 11804 | NA | NA |
| 1980 | 0 | NA | NA | NA | NA | NA | NA | NA | NA | NA | NA | NA | 12206 | NA | NA |
| 1981 | 0 | NA | NA | NA | NA | NA | 59317 | 7127 | 66444 | 4452 | 14388 | 10936 | 25325 | 96220 | |
| 1982 | 0 | NA | NA | NA | NA | 87874 | 54812 | 6262 | 61073 | 4984 | 14338 | 9210 | 23548 | 89605 | |
| 1983 | 0 | NA | NA | NA | NA | 89231 | 50284 | 7975 | 58259 | 5723 | 12827 | 9096 | 21923 | 85905 | |
| 1984 | 0 | NA | NA | NA | NA | 80133 | 50047 | 6136 | 56183 | 7180 | 11355 | 9485 | 20843 | 84191 | |
| 1985 | 0 | NA | NA | NA | NA | 84783 | 48492 | 4482 | 52974 | 8394 | 10516 | 9205 | 19721 | 81090 | |
| 1986 | 0 | NA | NA | NA | NA | 78565 | 43104 | 4330 | 47434 | 8762 | 8364 | 8561 | 16924 | 73121 | |
| 1987 | 0 | 56938 | NA | NA | 22688 | 79627 | 42732 | 3879 | 46611 | 9786 | 7780 | 8723 | 16503 | 72900 | |
| 1988 | 0 | 58024 | NA | NA | 23903 | 81927 | 41343 | 3983 | 45326 | 10234 | 7590 | 8431 | 16021 | 71581 | |
| 1989 | 0 | NA | NA | NA | NA | 78422 | 40650 | 3822 | 44472 | 10153 | 3099 | 3450 | 8056 | 14607 | 70328 |
| 1990 | 0 | 58290 | 9084 | 16783 | 25867 | 84157 | 38439 | 3841 | 42280 | 9312 | 2476 | 3758 | 8087 | 14321 | 65912 |
| 1991 | 0 | 55025 | 8687 | 19683 | 28369 | 83395 | 33979 | 3853 | 37832 | 9203 | 2031 | 3655 | 7539 | 13282 | 60219 |
| 1992 | 8440 | 53864 | 9303 | 22329 | 31632 | 93936 | 35727 | 35727 | 8812 | 11779 | 53403 | ||||
Source: Annual Reports. Management Reports 1992,1993. RENFE TABLE 11. REVENUE PER PASSENGER-KM AND TONNE-KM AT 1992 PRICES (ptas) FEDEA - D.T. 94-15 by J. Dodgson and P. Rodríguez
| PASSENGER | CARGAS COMPLETAS | COMBINADO | PAQUETERIA | FREIGHT TOTAL | |||||||||||
| AVE | LARGO RECORR. | REGION. | CERCANIAS | REG. & CERCANIAS | TOTAL | FULL WAGON | INTERNAL TRANSPORT | TOTAL | TOTAL | CARGO EXPRESS | PAQUETE EXPRESS | CORREOS | TOTAL | ||
| 1977 | NA | NA | NA | NA | NA | NA | 8,03 | NA | NA | 3,19 | NA | NA | 26,69 | NA | NA |
| 1978 | NA | NA | NA | NA | NA | NA | NA | NA | NA | NA | NA | NA | 30,65 | NA | NA |
| 1979 | NA | NA | NA | NA | NA | NA | NA | NA | NA | NA | NA | NA | 32,37 | NA | NA |
| 1980 | NA | NA | NA | NA | NA | NA | NA | NA | NA | NA | NA | NA | 33,87 | NA | NA |
| 1981 | NA | NA | NA | NA | NA | NA | 7,09 | 13,88 | 7,48 | 4,22 | 52,68 | 30,22 | 36,25 | 9,07 | |
| 1982 | NA | NA | NA | NA | NA | 5,98 | 6,75 | 13,45 | 7,11 | 3,87 | 63,84 | 26,99 | 37,32 | 8,53 | |
| 1983 | NA | NA | NA | NA | NA | 5,91 | 6,19 | 15,06 | 6,74 | 4,26 | 59,33 | 27,69 | 36,08 | 8,11 | |
| 1984 | NA | NA | NA | NA | NA | 5,15 | 5,59 | 15,1 | 6 | 4,27 | 54,72 | 28,79 | 34,76 | 7,22 | |
| 1985 | NA | NA | NA | NA | NA | 5,31 | 5,59 | 13,37 | 5,88 | 4,14 | 50,15 | 26,63 | 32,2 | 6,96 | |
| 1986 | NA | NA | NA | NA | NA | 5,01 | 5,24 | 14,08 | 5,55 | 4,05 | 41,97 | 25,11 | 28,8 | 6,48 | |
| 1987 | NA | 6,15 | NA | NA | 3,69 | 5,17 | 5,3 | 12,79 | 5,57 | 3,88 | 39,71 | 26,02 | 28,42 | 6,35 | |
| 1988 | NA | 6,15 | NA | NA | 3,83 | 5,21 | 5,19 | 9,29 | 5,4 | 3,76 | 38,65 | 24,59 | 27,15 | 6,11 | |
| 1989 | NA | NA | NA | NA | NA | 5,33 | 5,03 | 8,31 | 5,2 | 4,02 | 19,49 | 73,56 | 23,46 | 26,59 | 6,05 |
| 1990 | NA | 6,89 | 4,6 | 3,65 | 3,94 | 5,6 | 4,96 | 8,28 | 5,15 | 3,77 | 18,48 | 70,91 | 24 | 27,33 | 5,88 |
| 1991 | NA | 6,89 | 4,57 | 3,84 | 4,03 | 5,55 | 4,75 | 7,94 | 4,96 | 3,84 | 18,3 | 68,96 | 23,71 | 27,56 | 5,73 |
| 1992 | 16,45 | 6,91 | 4,32 | 3,79 | 3,93 | 5,75 | 5,67 | 0 | 5,42 | 3,92 | 28,45 | 5,7 | |||
| Source: Annual Reports, Management Reports 1992, 1993, RENFF | |||||||||||||||
Source: Annual Reports. Management Reports 1991,1992. RENFE TABLE 12. AVERAGE LENGTH OF HAUL FEDEA - D.T. 94-15 by J. Dodgson and P. Rodríguez
| PASSENGERS | CARGAS COMPLETAS | COMBINADO TOTAL | PAQUETERIA | FREIGHT TOTAL | |||||||||||
| YEAR | AVE | LARGO RECORR. | REGION | CERCAN. | REG. & CERCAN. | TOTAL | FULL WAGON | INTERNAL | TOTAL | CARGOEX | PAQUEXP | CORREOS | TOTAL | ||
| 1970 | n.a | n.a | n.a | n.a | n.a | n.a | n.a | n.a | n.a | n.a | n.a | n.a | n.a | 314 | |
| 1971 | n.a | n.a | n.a | n.a | n.a | n.a | n.a | n.a | n.a | n.a | n.a | n.a | n.a | 297 | |
| 1972 | n.a | n.a | n.a | n.a | n.a | n.a | n.a | n.a | n.a | n.a | n.a | n.a | n.a | 296 | |
| 1973 | n.a | n.a | n.a | n.a | n.a | n.a | n.a | n.a | n.a | n.a | n.a | n.a | n.a | 307 | |
| 1974 | n.a | n.a | n.a | n.a | n.a | n.a | n.a | n.a | n.a | n.a | n.a | n.a | n.a | 292 | |
| 1975 | n.a | n.a | n.a | n.a | n.a | n.a | n.a | n.a | n.a | n.a | n.a | n.a | n.a | 284 | |
| 1976 | n.a | n.a | n.a | n.a | n.a | n.a | n.a | n.a | n.a | n.a | n.a | n.a | n.a | 299 | |
| 1977 | n.a | n.a | n.a | n.a | n.a | 294 | 265 | 292 | 842 | 161 | 440 | 428 | 155 | 305 | |
| 1978 | n.a | n.a | n.a | n.a | n.a | 288 | 178 | 282 | 714 | 211 | 440 | 425 | 179 | 299 | |
| 1979 | n.a | n.a | n.a | n.a | 80,7 | 284 | 189 | 279 | 674 | 227 | 440 | 425 | 188 | 296 | |
| 1980 | n.a | n.a | n.a | n.a | 80,9 | n.a | n.a | n.a | n.a | n.a | n.a | n.a | n.a | 298 | |
| 1981 | n.a | n.a | n.a | n.a | 80,9 | 286 | 175 | 276 | 669 | 714 | 440 | 429 | 509 | 302 | |
| 1982 | n.a | n.a | n.a | n.a | 80,9 | 302 | 184 | 292 | 677 | 620 | 439 | 427 | 482 | 322 | |
| 1983 | n.a | n.a | n.a | n.a | 80,9 | 312 | 173 | 297 | 677 | 619 | 444 | 448 | 496 | 328 | |
| 1984 | n.a | n.a | n.a | n.a | 80,7 | 334 | 164 | 320 | 653 | 584 | 443 | 464 | 497 | 353 | |
| 1985 | n.a | n.a | n.a | n.a | 81,1 | 343 | 155 | 328 | 671 | 620 | 437 | 471 | 509 | 368 | |
| 1986 | n.a | n.a | n.a | n.a | 85,1 | 337 | 145 | 321 | 662 | 621 | 409 | 464 | 501 | 364 | |
| 1987 | n.a | n.a | n.a | n.a | 81,1 | 345 | 161 | 331 | 676 | 619 | 440 | 472 | 510 | 380 | |
| 1988 | n.a | n.a | n.a | n.a | 81 | 351 | 181 | 335 | 673 | 620 | 449 | 478 | 514 | 387 | |
| 1989 | n.a | n.a | n.a | n.a | 81 | 342 | 179 | 326 | 619 | 617 | 458 | 484 | 514 | 371 | |
| 1990 | 509 | 89,8 | 20,4 | 26,6 | 56,9 | 359 | 179 | 340 | 640 | 618 | 465 | 490 | 514 | 386 | |
| 1991 | 508 | 90 | 18,4 | 23,4 | 47,5 | 346 | 180 | 327 | 633 | 617 | 457 | 542 | 546 | 375 | |
| 1992 | 390 | 518 | 93,7 | 18,4 | 23,5 | 45,6 | 350 | 180 | 336 | 610 | 623 | 460 | 630 | 597 | 381 |
Source: Annual Reports. Management Reports 1991, 1992. RENFE. TABLE 13. AVERAGE LENGTH OF HAUL BY TYPE OF PRODUCTS (CARGAS COMPLETAS) FEDEA - D.T. 94-15 by J. Dodgson and P. Rodríguez
| CEREAL | COAL | TIMBER | CEMENT | LIMEST | MIN | IRON&S | FLAM-LI | CHEM | PROPAN | FERT | MOTOR | MILIT | TARIF | MOTOR | OTHER | |
| 1977 | 516 | 159 | N.A. | 143,6 | N.A. | 164,8 | 443 | 213 | 584 | 463 | 352 | 530 | N.A. | 671 | N.A. | N.A. |
| 1978 | 492 | 141 | N.A. | 124,2 | N.A. | 140,4 | 431 | 220 | 686 | 420 | 372 | 489 | N.A. | 690 | N.A. | N.A. |
| 1979 | 445 | 127 | N.A. | 112,7 | N.A. | 141,8 | 481 | 217 | 713 | 378 | 358 | 518 | N.A. | 674 | N.A. | N.A. |
| 1980 | 473 | 127 | N.A. | 112,7 | N.A. | 141,8 | 459 | 217 | 714 | 377 | 359 | 518 | N.A. | ERR | N.A. | N.A. |
| 1981 | 452 | 204 | 937 | 108 | N.A. | 146,1 | 470 | 201 | 776 | 376 | 391 | 761 | N.A. | 664 | N.A. | N.A. |
| 1982 | 416 | 247 | 946 | 92,4 | N.A. | 139,1 | 518 | 235 | 794 | 386 | 420 | 820 | N.A. | 666 | N.A. | N.A. |
| 1983 | 479 | 250 | 879 | 88,9 | N.A. | 133,1 | 487 | 214 | 793 | 390 | 433 | 527 | 425 | 659 | N.A. | N.A. |
| 1984 | 580 | 220 | 810 | 88,2 | N.A. | 132,9 | 502 | 235 | 750 | 391 | 483 | 541 | 435 | 659 | N.A. | N.A. |
| 1985 | 547 | 191 | 878 | 88,6 | N.A. | 126,6 | 500 | 248 | 686 | 374 | 551 | 536 | 433 | 663 | N.A. | N.A. |
| 1986 | 567 | 188 | 810 | 75,7 | N.A. | 127,8 | 509 | 253 | 597 | 340 | 523 | 577 | 407 | 663 | N.A. | N.A. |
| 1987 | 549 | 212 | 751 | 190,3 | 44,8 | 107,1 | 514 | 262 | 589 | 322 | 489 | 627 | 387 | 672 | N.A. | N.A. |
| 1988 | 527 | 216 | 755 | 188,4 | 43,4 | 106 | 519 | 214 | 571 | 339 | 485 | 631 | 471 | 661 | N.A. | N.A. |
| 1989 | 529 | 228 | 730 | 203,1 | 45,3 | 108,3 | 561 | 212 | 564 | 345 | 460 | 622 | 494 | 662 | 4011 | 0 |
| 1990 | 534 | 239 | 717 | 211,9 | 46 | 101,4 | 526 | 241 | 599 | 343 | 438 | 634 | 541 | 599 | 523 | 487 |
| 1991 | 480 | 224 | 837 | 212,4 | 47,3 | 98,7 | 518 | 295 | 633 | 374 | 448 | 603 | 528 | 607 | 492 | 446 |
| 1992 | 454 | 195 | 823 | 206,5 | 42,4 | 97,7 | 511 | 330 | 609 | 412 | 461 | 600 | 517 | 569 | 474 | 467 |
TABLE 14. TRAIN-KMS (millions) Source: Annual Reports. Management Reports 1991, 1992. RENFE / UIC STATISTICS.
| PASSENGERS | FREIGHT TOTAL | ||||||
| YEAR | AVE | LARGO RECORRIDO | REGIONALES | CERCANÍAS | REGIONALES CERCANÍAS | TOTAL | |
| 1970 | 0 | N.A. | N.A. | N.A. | N.A. | 80,497 | N.A. |
| 1971 | 0 | N.A. | N.A. | N.A. | N.A. | N.A. | N.A. |
| 1972 | 0 | N.A. | N.A. | N.A. | N.A. | N.A. | N.A. |
| 1973 | 0 | N.A. | N.A. | N.A. | N.A. | N.A. | N.A. |
| 1974 | 0 | N.A. | N.A. | N.A. | N.A. | N.A. | N.A. |
| 1975 | 0 | N.A. | N.A. | N.A. | N.A. | 83,754 | N.A. |
| 1976 | 0 | N.A. | N.A. | N.A. | N.A. | 86,2 | 45,4 |
| 1977 | 0 | N.A. | N.A. | N.A. | N.A. | 91,2 | 44,2 |
| 1978 | 0 | N.A. | N.A. | N.A. | N.A. | N.A. | N.A. |
| 1979 | 0 | N.A. | N.A. | N.A. | N.A. | N.A. | N.A. |
| 1980 | 0 | N.A. | N.A. | N.A. | N.A. | 94,859 | 42,311 |
| 1981 | 0 | N.A. | N.A. | N.A. | N.A. | 100,26 | 40,767 |
| 1982 | 0 | N.A. | N.A. | N.A. | N.A. | 103,361 | 40,899 |
| 1983 | 0 | N.A. | N.A. | N.A. | N.A. | 103,274 | 41,944 |
| 1984 | 0 | N.A. | N.A. | N.A. | N.A. | 104,308 | 46,606 |
| 1985 | 0 | N.A. | N.A. | N.A. | N.A. | 103,162 | 48,854 |
| 1986 | 0 | N.A. | N.A. | N.A. | N.A. | 105,921 | 50,402 |
| 1987 | 0 | N.A. | N.A. | N.A. | N.A. | 103,14 | 48,352 |
| 1988 | 0 | N.A. | N.A. | N.A. | N.A. | 110,156 | 48,959 |
| 1989 | 0 | N.A. | N.A. | N.A. | N.A. | 109,914 | 48,214 |
| 1990 | 0 | N.A. | N.A. | N.A. | N.A. | 120,449 | 48,631 |
| 1991 | 0 | 50,1 | 31,1 | 46,3 | 77,4 | 127,604 | 45,232 |
| 1992 | 2,1 | 48,6 | 30 | 52 | 82 | 132,7 | 47,01 |
Source: Carbajo et De Rus (1991) / 100 Datos estadisticos 1988-89. Management Reports 1991,1992. RENFE NOTE: Traffic is the sum of passenger-kms and tonne-kms.
| NUMBER OF | TRAFFIC | TRAFFIC PER 1000 | |
| 1984 | 70172 | 27228 | 388 |
| 1985 | 65907 | 27633 | 419 |
| 1986 | 64165 | 26985 | 421 |
| 1987 | 55811 | 26869 | 481 |
| 1988 | 51757 | 27432 | 530 |
| 1989 | 49863 | 26334 | 528 |
| 1990 | 49380 | 26231 | 531 |
| 1991 | 48484 | 25529 | 527 |
| 1992 | 45971 | 25711 | 559 |
Este texto se ha extraído automáticamente del documento original. Para citarlo o leerlo con su maquetación, descargue el PDF.
Descargar en PDF