Workforce adjustment in Spain: Are working hours a choice variable?* by Carlos García-Serrano** Juan F. Jimeno*** Luis Toharia****
DOCUMENTO DE TRABAJO 95-01
February 1995
* This is a revised version of a paper presented at the workshop on "Short-time Working and Structural Change", WZB, Berlin, December 16 and 17, 1994.
** Universidad de Alcalá de Henares.
** Universidad de Alcalá de Henares and FEDEA.
*** Universidad de Alcalá de Henares.
Abstract
This paper provides background information on the legal constraints affecting short-time working, and on the observed incidence of short-time working schemes in Spain. After reviewing job security regulation in regards to permanent and temporary dismissals and to working hours reduction, we provide some indexes of the rate of utilization of internal workforce adjustment by Spanish firms. We conclude that this type of adjustment is scarcely frequent and heavily concentrated among particular manufacturing industries with specific technological characteristics. We discuss the theoretical arguments available in the literature about the determinants of the incidence of internal workforce adjustment, and suggest that further research is needed to fully understand the relative importance of legal, technological and economic constraints to short-time working, and to justify a public policy oriented towards work-sharing by reducing working hours.
JEL Codes: J21, J65
1. Introduction
Spain is the country with the highest and stubborn unemployment rate among OECD countries. Its performance on employment creation and the evolution of the employment rate in the two recent decades are also rather disappointing. The Spanish economy has suffered two very intense employment crises in the last two decades. First, from the mid-seventies up to the mid-eighties, employment decreased at an annual rate of -1.7%. Then, employment surged during the second half of the eighties (the average annual growth rate of employment was 3.5% in the 1986-90 period). During the recent recession, employment fell by -1.9% in 1992 and by -4.3% in 1993. Thus, mass and persistent unemployment coexist with wide swings in total employment.
On the other hand, annual working hours, despite a very rapid and continuous decrease during the eighties, are high, for European standards. Thus, while employment is highly correlated with economic activity, working hours have followed a decreasing trend with not noticeable reaction to temporary or permanent falls in activity. In spite of supposedly restrictive job protection legislation, firms use firings as the main instrument to adjust to declines in activity. Moreover, since fixed-term employment was liberalized in 1984, the proportion of fixed-term employment has surpassed 30% and workers on these contracts have suffered a great deal of the burden of workforce adjustment.
Why are dismissals the main workforce adjustment measure? Why are short-time working schemes and work sharing programs not observed more often as instruments to mitigate the incidence of unemployment? Is the job protection regulation biased against short-time working? Is short-time working a better outcome from an economic and social point of view? Should Spanish job protection regulation lead toward a higher punishment of firings and to provide incentives for short-time working? Should distinctions be made between the use of short-time working for adjustment to transitory and permanent falls in demand?.
The main goal of this paper is to provide information from the Spanish experience on workforce adjustment. The analysis of this information should be the first step to address the questions above. In Spain, workforce adjustment is mainly external, through dismissals and firings, and, to a lesser extent, internal by means of temporary layoffs. Short-time working, as a measure of internal workforce adjustment to declines in activity, is almost nonexistent.
However, this lack of short-time working programs should not be interpreted as an indication that work-sharing, has not taken place in Spain. In fact, fixed-term employment has been the Spanish way of filling the same jobs with different people. Given the high firing costs implied by permanent employment contracts, firms have mostly used fixed-term contracts that require workers to be promoted to permanent workers after at most three years or being dismissed. As a result, there has been a high turnover rate between employment and unemployment. In fact, it would be very difficult to grasp the reasons for the rather low incidence of internal workforce adjustment measures, without the understanding of firing regulations and some characteristics of fixed-term employment contracts.
The structure of the paper is as follows. In section 2, we describe the main institutional characteristics of the Spanish labor market, regarding internal and external workforce adjustment, with a special attention to the regulation of short-time working schemes. As a general comment, it can be said that short-time working is not differently regulated than temporary layoffs. This fact and the high incidence of fixed-time employment are the main reasons for working hours not being a variable that employers and workers want to adjust after declines in economic activity. In section 3, we turn to provide the main facts on internal workforce adjustment in Spain during the last decade. Since the Spanish regulation in this regard has not particularly strong incentives to the use of short-time working schemes, it is not surprising that they have become rather unusual and that firings and, to a lesser extent, temporary layoffs are the almost exclusive channels through which workforce adjustment takes place. Finally, in section 4, we discuss the theoretical arguments which may explain the incidence of short-time working. Lacking government intervention, there are several reasons by which firms (and even workers) prefer firings to short-time working, as the way to adjust to declines in firms' demand. These reasons are mostly related to the nature of bargaining, technical restrictions and dynamic effects of the two alternatives above, and imply that short-time working requires the intervention of a "third party" that subsidizes such schemes and penalizes firings . A full assessment of these restrictions need to be made before any policy recommendations on work-sharing by short-time working can be derived.
2. Workforce adjustment in Spain: Institutional aspects
In Spain, a change in the employment relationship implying short-time working requires prior administrative approval. Up to 1994, and since the years of the Franco dictatorship, any action taken by firms about workforce adjustment grounds was to be preceded, at least on legal grounds by a procedure initially called "crisis process", later "employment regulation process" (Expediente de regulación de empleo, from now on ERE). This procedure basically considers three possible courses of action: Permanent dismissal of workers, temporary layoff of workers and temporary reduction of working time (i.e., short-time working) for some or all workers.
Although these regulations existed before, as already mentioned, their clearest formulation dates from 1980, when the Workers' Statute (Ley del Estatuto de los Trabajadores, hereafter quoted as LET) was passed in Parliament. The LET established a common procedure for all types of ERE, the only difference being that, in case of layoffs or short-time working, the time allowed to the labor market authorities to decide on an ERE were half of those allowed in the case of dismissals. As a matter of fact, the law does not make any specific distinction between layoffs and short-time working, the two apparently belonging to the same category ("employment suspension").
Another question is whether there are either efficiency or distribution arguments that rationalize such subsidies.
Needless to say, many firms have used other ways of adjusting their workforce for economic reasons, mainly through what the so-called "dismissals on objective grounds", the possibility of which was established in 1980. More information on dismissals in Spain may be found in Jimeno and Toharia (1994a).
The precise procedure was as follows. To initiate an ERE, the employer had to open a 30-day-period of consultation with workers' representatives, in order to agree with them. At the end of this period, the following possibilities existed:
- an agreement was reached. In this case, it was so notified to the labor authority, which normally certified it. This was the most frequent case: Some 75\% of the total number of ERE were agreed and then accepted.
- an agreement was not reached. In this case, the employer had to provide information on the situation of the firm to the labor authority, who had to decide, before 30 days, whether to accept or reject the ERE. If the ERE was rejected (this being so if no answer was given within the established period), the firm could go to the central Ministry, who had another 15 days to decide the case. At this stage, if no answer was given, the ERE was accepted. If the ERE was rejected, it was sent back to the firm with the recommendation that an agreement be reached with the workers. The percentage of ERE accepted by the labor authority was approximately 80% of the ERE not agreed, equivalent to 20% of the total number of ERE.
It should be added that the delays were half of those mentioned in the case of firms with less than 50 employees and when the ERE involved less than 5% of the current workforce of the establishment. The times were also half as above in the case of layoffs and short-time work.
The workers dismissed, laid-off or under short-time working were entitled to receiving unemployment benefits, provided they had contributed to the unemployment insurance system long enough (six months before April 1992, one year thereafter). The same rules applied to all of them. The only proviso added in the case of short-time workers is that the benefit was proportional to the amount of working time reduction; in addition, a threshold for working time reduction of 1/3 of normal hours was established to be entitled to receiving benefits. These benefits were against their total benefits; it could thus happen that a worker, when dismissed, might have already exhausted most of his/her benefits in previous short-time or layoff episodes.
This may be the provincial delegation of the Ministry of Labour or the regional authorities or the central Ministry itself, depending on the nature of the ERE and whether the region where the firm is established is responsible for handling labour matters.
This refers to the total number of ERE. Disaggregated information by types does not exist, although it can be presumed that dismissals ERE carry a lower percentage of agreement.
As part of the ERE, the firm might agree to supplement the workers' income so that no actual loss was experienced during the period of layoff or short-time. In the case of both layoffs and short-time work, employers had to pay social contributions for those workers affected.
In all cases, any dismissal carried a minimum severance of 20 days' wages per year of seniority (with a maximum of 12 months' wages). Finally, in the case of firms with less than 25 workers, the state paid, through the wage guarantee fund (FOGASA), 40 percent of the legal severance payment.
The recent labor market reform of May 1994 has introduced several changes to this scheme. First, a distinction has been made between individual and collective dismissals. Economic reasons are now accepted as a legal ground for individual dismissal (recognizing what was usual practice), and EREs are now restricted to collective dismissals. Secondly, the ERE procedure has been somewhat changed:
- at the time of initiating the ERE, the firm has now to both initiate negotiations with its workers and to notify the labor market authority, providing the necessary information to justify the measures proposed (in the prior regulation, this documentation had to be given only when no agreement was reached with the workers);
- negotiations with workers must last "at least 30 days" (the minimum requirement was not established in the previous regulation).
- in the case of firms over 50 workers, a "social plan" is to be added to the initial documents of the ERE.
- after the period of consultations, if there is agreement, the labor authority will simply certify it within 15 days.
- should an agreement not be reached, the labor market authority will take a decision within 15 days, with the proviso that if no decision is taken on time, the ERE shall be deemed accepted.
On the whole, the new procedure puts a heavier burden on the negotiation and tries to limit the role of the labor market authority. In exchange, the firm is now required to disclose information on its situation right at the beginning of the process as well as to prepare, for those over 50 workers, a social plan. Neither severance payments nor access to unemployment benefits have been changed. At any rate, the spirit of the reform appeared to be simplifying matters and reducing times of resolution.
Prior to 1994, unemployment benefits were tax-exempt. This has to be taken into account here, as after-tax replacement ratios could well be above 100%, especially prior to 1992 when the initial gross replacement rate was 80% of previous wages.
Needless to say, these amounts could be higher if so agreed.
The ET established that the State would pay 40% of the severance pay agreed. This was corrected in 1984 to become 40% of the legal severance pay, because of the obvious perverse incentives created by the initial system.
The regulation for temporary layoffs and short-time work has not been further changed beyond the changes mentioned above, though: they are still subject to an ERE whose procedures are similar to those established for EREs with dismissals. Decision times are still half of those applicable to ERE with dismissals; documentation required is less burdensome to the firm.
Needless to say, all of the above applies to permanent workers only. Temporary or fixed-term workers , whose labor contract has a limited and well-defined duration, can be discharged by simply not having their contracts renewed. This is an important caveat, as 1/3 of all employees in Spain work under a contract of this type.
In addition, it should be mentioned that all of the above measures, in particular those related to layoffs and short-time work, are seen as temporary solutions to cyclical problems rather than structural difficulties. No explicit work-sharing programs (like subsidized on-leave programs or subsidized short-time working) are in effect as response to permanent demand declines in some sectors caused by structural changes in the Spanish economy.
3. Temporary layoffs and short-time working in Spain
3.1. Working hours
As a first step toward the empirical analysis of short-time working in Spain, we can glance at the evolution of the working time. There are two usual measures of working hours: the average weekly number of working hours and the yearly number of hours. The growing flexibility of working time in the last twenty years, caused by the increasing incidence of temporary and part-time employment, makes the latter a more suitable measure of working hours. We shall also use the average weekly number of working hours when yearly figures are not available, though.
Table 1 contains data on yearly hours from different OECD countries for several years within the 1970-90 period. These data show a continuous decline in the number of working hours across countries, with the only exception of Sweden in the eighties. Some countries show a dramatic decline in the seventies (the cases of Norway, Sweden and Germany) and others in the eighties (Spain and the Netherlands). Since working hours differ across sectors, being highest in Agriculture and lowest in
Temporary workers undertake activities which by nature are temporary; fixed-term workers undertake activities which are normal to the firm, but they do so for a limited amount of time. Since 1984, the minimum contract time was 6 months, renewable to a maximum length of 3 years. In 1992, the minimum was extended to 1 year. The maximum was temporarily extended to 4 years. Starting in May 1994, these fixed-term contracts have been suppressed on general grounds, their use being restricted to apprenticeship and practice contracts as well as specific employment policy measures to be decided on a yearly basis in the budgetary law.
Services (see table 2), changes in the sectoral composition of employment have some effects in the evolution of working hours.
There are other factors influencing the evolution of the yearly number of working hours, being the incidence of part time and temporary employment a major source of variation across time and across countries. Thus, we first present data on the evolution of fixed-term contracts and part-time work, to turn, afterwards, to provide the facts on internal working hours adjustment schemes in the Spanish labor market.
3.2. Temporary and part-time employment
Nowadays, there exist a wide variety of employment contracts that firms can use in Spain. Liberalisation of temporary contracts took place in late 1984, and further reforms have taken place recently. The result has been a rapid increase of the proportion of temporal contracts in the Spanish economy since the mid-80's, as it can be seen in table 3. From 1987 to 1991, the proportion of workers with temporal contracts increased from one sixth of total wage workers to one third of that number; since 1991, the proportion has maintained more or less constant. Two types of temporary contracts must be disentangled: temporary contracts used to fill jobs with a seasonal or fixed-term duration, and temporary contracts "without a cause", which are used mainly to avoid the firing restrictions embedded in the "typical" permanent ful-time employment contract. If we only take account of the latter, then the proportion of fixed-term employment has raised from in 1987 to about in 1991 and thereafter. This evolution is important in regard to the evolution of working hours (since temporary workers work, on average, less hours than permanent workers[1]). But, more importantly and as we shall see below, a high the proportion of fixed-term employees implies less restrictions to workforce adjustment and, thus, short-time working schemes as response to demand fluctuations are less needed.
One aspect that must be stressed is the sectoral dispersion of the incidence of fixed-term employment. As seen in table 4, manufacturing and services have a below average proportion industries of fixed-term employment, while in Agriculture and Construction, the incidence of fixed-term employment is highest, mainly because there are relatively more seasonal and fixed term jobs. This sectoral dispersion is also closely related to the sectoral dispersion of short-time working schemes.
Additionally, part-time employment can also be used as flexible forms to adjust working hours. Until recently and because of a restrictive regulation of part-time employment contracts, the incidence of this kind of employment in the Spanish economy has been rather low, as seen in table 5. In fact, part-time employment in Spain is at a proportion similar to other Southern European countries (Italy, Greece or Portugal) but much lower than in Northern European countries.
See Segura et. al. (1991)
3.3. Short-time Working
The main statistical source to get information on internal workforce adjustment is the data base referred to the EREs published by the Ministry of Employment and Social Security.
First, tables 6, 7 and 8 show the basic data referred to the total number of EREs made by firms and approved by administrative authorities, the total number of workers affected and the average number of workers affected per ERE. Data are disaggregated by form of adjustment (reduction in working time, temporary layoffs, and dismissals), industry (agriculture, manufacturing, construction, and services), and firm's size (ranging from 1-25 workers to more than 5,000 workers).
As seen in figure 1, the number of EREs shows a clear cyclical pattern: They increased in the last 70's, maintained high levels in the first half of the 80's, slowed down in the second half of the 80's and increased again in the first years of the 90's. This cyclical pattern can be observed both in regards to temporary layoffs and to permanent layoffs. However, it is much less pronounced in the case of the reduction of working hours, since it shows a continuous decreasing trend from 1981 to 1990 to slightly recover afterwards.
As for sectoral disaggregation, table 7 shows that manufacturing firms are more prone to implement EREs, although the proportion of EREs in manufacturing has been decreasing (from 61% of the total number in 1980 to 48% in 1993). The proportion of EREs in small firms (those more extended in the Spanish economy) is both high and increasing (63% in 1980 and 75% in 1993), which is above the proportion of this type of firms in the Spanish economy.
Not surprisingly, the number of workers affected by EREs also follow a cyclical pattern: They increased from the last 70's to the mid-80's and decreased since then due to the economic expansion of the second half of the 80's. However, the impact of the recent recession in 1992-1993 has made the number of workers affected by EREs to surge again. As seen in figure 2, the evolution of total number of workers affected by EREs is mainly driven by temporary layoffs, which account for an important proportion of the total number of workers involved in the adjustment process (from 45% in 1979 to 70% in 1993).
The sectoral composition of workers affected by EREs is similar to the incidence of EREs by sectors. First, manufacturing is by far the main sector in relation to the number of workers affected. Second, although firms with less than 26 workers are those presenting a higher number of EREs, the number of workers affected is relatively higher in medium-sized firms (51-500 workers) and, specially in recession years, on the biggest companies. As a result, the average number of workers involved in EREs, shown in table 8, increased from the late 70s through the mid-80s to decrease afterwards. If we consider the form of the adjustment, that pattern has been guided by the scheme related to the reduction of working hours: the average number of workers in this kind of adjustment process increased in the early 80's, and figures over one hundred were usual in many years of the 80's but have decreased substantially in the 90's. The average number in the other two schemes were more or less constant over the period of observation. By industry, manufacturing is the sector with a higher average number (over 40 in all the period), the rest showing lower figures. Finally, regarding firm's size, there exists a direct relationship between the size and the average number of workers involved, as one could imagine a priori. However, there must be said that the average number of workers in the case of companies over 5,000 workers differs very much among years due to the number of workers involved in each of the ERE, not to the number EREs made.
Now we turn to the distribution of the total number of workers affected by industry and size of firms within each of the workforce adjustment alternatives (see tables 9 and 10). As we stated previously, manufacturing is the industry which concentrates most of the workers affected by internal flexible adjustment processes. This is specially true in the case of the reduction in working hours (nearly the 100%) but less in the case of temporary layoffs (although it has reached nearly the 90% in 1993). As far firm's size is concerned, either reduction in working hours or temporary layoffs are concentrated on companies with more than 100 workers. However, we have to highlight two aspects: first, in the case of the working hours form, the contribution of companies with more than 5,000 workers differs greatly among years; and second, firms with less than 26 workers use more intensely the temporary layoffs, as their participation is higher in this kind of workforce adjustment.
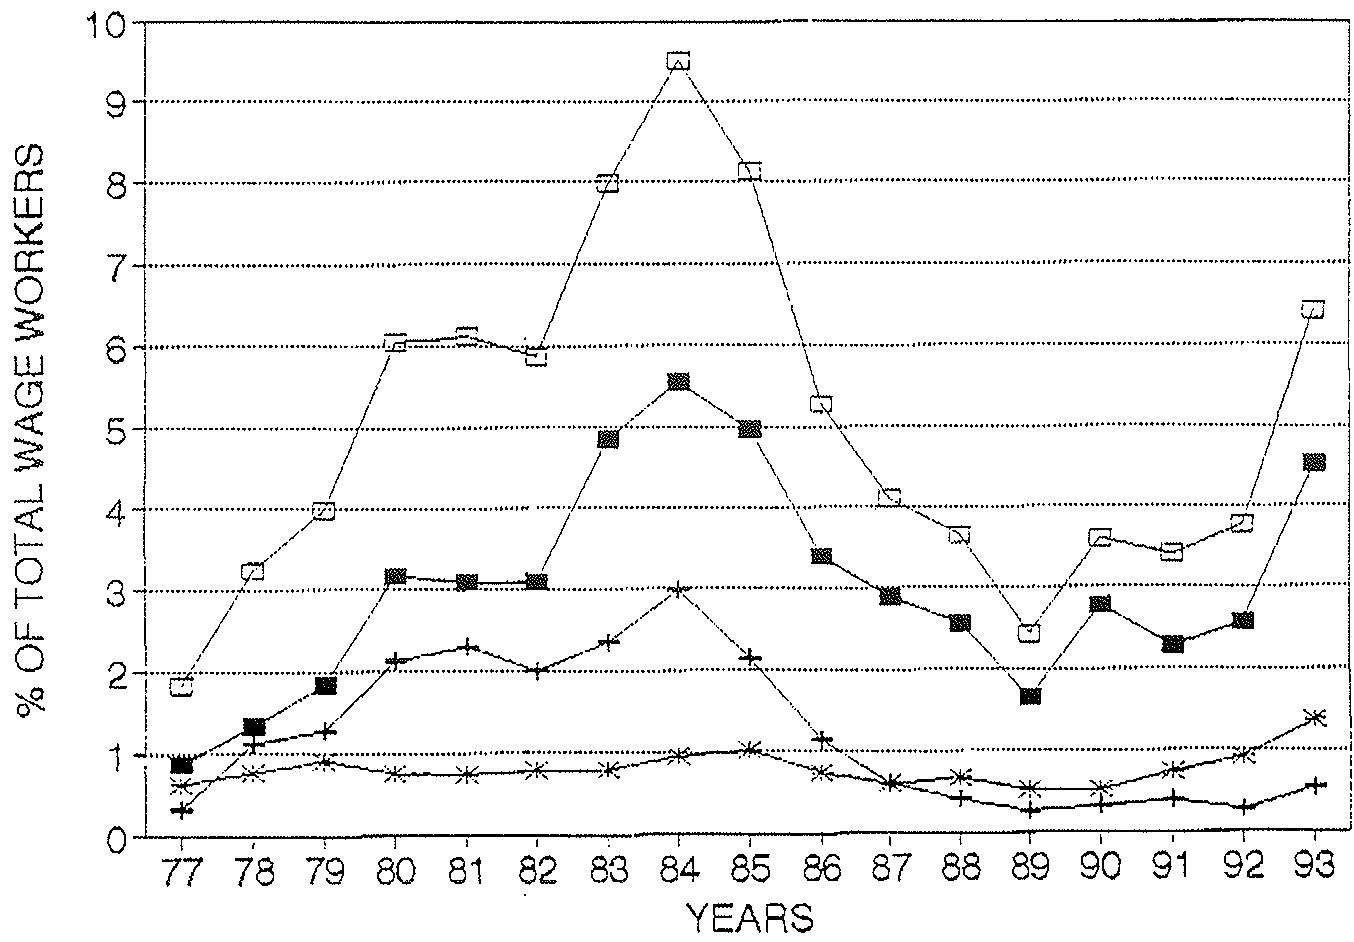
Now we are interested on having an estimate of the incidence of the flexible forms of workforce adjustment on the whole economy. To obtain such a measure, we relate the number of workers effectively affected by those forms of adjustment and the total number of workers that could theoretically be affected. We have the first figure; with regard to the second, we are going to take the number of wage workers in the economy (and in each industry). The estimate of the incidence of flexible forms of workforce adjustment with respect to wage workers is shown in table 11. In table 12, more disaggregated data are given. We stress the following aspects:
- First, no more than 6% of the total wage workers were affected by temporary layoffs in the year of more intensity use of this internal adjustment form, i.e., 1984. However, we can state that this kind of adjustment process shows a cyclical pattern: Their use increases in periods of economic crisis and increasing unemployment (1977-85 and 1992-93) and decreases in periods of economic expansion and employment creation (1986-91).
Second, manufacturing is the industry in which the use of workforce adjustment forms is more extended, conducting the cyclical pattern described above. The estimated incidence increased in the early 80's, reaching a maximum of in 1984; then, the incidence decrease to about in period 1988-91. But it increased substantially in the last three years.
- Third, incidence in the agricultural sector has maintained at about 4-6% since the early 80's. Also, the incidence in construction and services is very low and has decreased continuously since the early 80's.
- Fourth, if we distinguish between temporary layoffs and reduction of working hours as forms of flexible workforce adjustment in each industry, we observe that all the industries use temporary layoffs more intensively. This is specially true in the case of the agriculture sector. About manufacturing, firms use both forms of adjustment equally until 1983, but since then they prefer temporary layoffs; in this way, it is very significant the lack of use of the working hours: from 9% of the total wage workers to less than 2% only three years later.
We can obtain a more concrete insight into the incidence of those forms of workforce adjustment if we consider the following information: we have calculated the incidence for different sub-sectors of the manufacturing sector, as this is the industry in which the adjustment of the workforce has been most intense. The data are shown in tables 13 and 14, and are given for 22 manufacturing sub-sectors.
With regard to the use of temporary layoffs, there exist a number of manufacturing sub-sectors for which incidence is (or was) very high (over 10% of their wage workers). Such cases are mainly five: "Extraction of solid fuels and coal", "Production of metallic goods", "Production of electric equipment", "Production of automobiles and their spare parts" and, above all, "Ship building". The rest of industries have used this adjustment form at a low rate (affecting to less than 10% of total wage workers). However, the incidence in some of them has been very scarcely (even below 1%): this is the case of "Extraction of oil and gas" and "Electricity, gas and water".
If we consider the sub-sectors using the reduction of working hours more intensely in relation to the number of their wage workers, one remarkable aspect is that they coincide to those using the other flexible form of workforce adjustment, except for "Extraction of solid fuels and coal", and adding "Production of mechanical equipment". One aspect that is necessary to stress is that the use has decreased greatly since 1984: the incidence was over in those sub-sectors but nowadays is at some lower levels. Another point is that there exists a higher number of sub-sectors (10) for which the incidence is very low in most of the years. This is related to the increasing incidence of fixed term employment, which can be used as an alternative workforce adjusting instrument.
As a final comment, table 15 contains data about the average number of days in temporary layoffs and the average number of hours of reduction. As for the number of days, it is between 90 and 120 (i.e., three and four months) in the whole period. Also, the number of hours is between 350 and 500 (which is equivalent to 40-60 days of work), but showing no clear temporal pattern.
The conclusion is that the use of flexible forms of workforce adjustment is very concentrated in some specific industries. These are of two types: one, productive activities plunged into a crisis since the 70's due to their high costs with the result of an intense reduction of their workforce ("Extraction of solid fuels and coal" and "Ship building"); and two, other activities related to the production of metallic, mechanical or electric equipment, which can be more affected by seasonal variations in the demand. There is a technological aspect common across these industries: These are mass production industries where team-work organized through assembly lines is predominant.
4. Adjusting working hours as an alternative to firings: When is it feasible?
As we have seen above, firms can adjust (and do adjust) their workforce either by dismissing workers, by temporary layoffs or by adjusting working hours. As for the employment relationship is concerned, there is an important difference between dismissals, on the one hand, and temporary layoffs and short-time working on the other. While dismissals imply the breakdown of the employment relationship, and therefore workforce adjustment takes place externally (through firings and hirings), temporary layoffs and short-time working are internal workforce adjustment measures that maintain employment relationships, although temporary layoffs are often perceived by workers as the first step toward dismissals of a fraction of the firm's workforce.
In an unregulated labor market, absent both externalities and distributional considerations, profit maximizing firms and utility maximizing workers would always choose the efficient levels of employment and working hours. However, labor markets require, by nature, the existence of certain institutions (like a public unemployment compensation system, collective bargaining, legal restrictions to some employment conditions, etc.) that affect both efficiency and distribution. Thus, it makes sense to wonder if employers and workers are choosing the optimal level of employment and working hours, given demand and institutional restrictions, and if some reforms in institutional restrictions would increase social welfare.
Institutions interact with each other, so that the economic effects of labor regulation are not independent on the whole set of institutions at work. Thus, regulation on internal workforce, in general, and on short-time working, in particular, must be analyzed considered other institutions like unemployment compensation programs and job protection legislation. Clearly, a publicly financed unemployment benefit system lowers the private marginal costs of dismissals to be burdened by workers. Job protection regulation increase firing costs. Adjustment in working hours may be preferred by workers to dismissals if the value that they attach to the employment relationship is higher than the plausible loss of earnings implied by working fewer hours. But, if this is the case, and temporary layoffs do not increase the probability of being fired, then temporary layoffs are preferred to short-time programs, as workers temporarily laid-off get unemployment compensation. From the employers' point of view, short-time working permits, in principle, costless workforce adjustment, since no firing costs are involved. However, if there is wage resistance, non-wage labor costs are different from zero, there are increasing returns to working hours or the workforce is heterogeneous, reductions in working hours may be costly, and even more so than temporary layoffs or dismissals.
Thus, in general, it would be necessary the implementation of publicly financed short-time compensation schemes, of similar nature to a "partial" unemployment compensation scheme, for workers to be willing to consider short-time working. It would also be necessary the existence of significant firing costs for employers to accept reductions in working hours, when workforce adjustment is an issue.
Previous studies on the tradeoffs between the level of employment and working hours, when unemployment compensation and job protection regulation are present, have analyzed two issues: i) the effects of a short-time compensation scheme on the efficiency of the resulting combination of employment and hours, and ii) the effects of a shot-time compensation scheme on the frequency and the size of the employers' response to adverse shocks. The main results of this line of research are:
i) The absence of a short-time compensation scheme produces excessive temporary layoffs, if the unemployment benefit system is not fully-rated. Short-time compensation schemes, if sufficiently generous, reduces temporary layoffs but implies underemployment, that is, working an inefficiently low number of hours. A fully-rated unemployment benefit system eliminates the inefficiencies in both cases (Wright and Hotchkiss (1988), Burdett and Wright (1989)).
ii) If there is not disutility of work, then the short-time compensation scheme has to be at least as generous as the unemployment benefit system for short-time working to take place (Van Audenrode (1994)). Otherwise, temporary layoffs will bear the burden of adjustment to declines in firms' activity.
However, these results are obtained under simplifying assumptions which make short-time working more plausible than under more realistic assumptions. The assumptions under which the two results above are derived are:
i) There is efficient bargaining between employers and workers. This means that there are contingent contracts under which workers' earnings and other labor costs depend on the state of nature. In other words, after a negative shock, workers' earnings and other labor costs fall, so that the reduction in employment needed to accommodate the shock is lower than under non-contingent employment contracts which have embedded some degree of wage rigidity. As a result, temporary layoffs or short-time compensations are lower under efficient bargaining. Contingent contracts under which both workers' earnings and non-wage labor costs depend on the state of nature are not usually observed.
ii) The number of effective hours is equal to the number of actual hours and the labor input is homogeneous. These two assumptions imply that "bodies" and "hours" are perfectly substitutes (thus, the average productivity of one employee working n hours is the same as the average productivity of n employees working one hour, for instance). In fact, there are many reasons why these two assumptions fall: There are jobs that, somewhat, are subject to indivisibility of working hours, workers may differ in ability, the amount of firm-specific human capital that they embody, etc. If for some reasons, there are decreasing returns to reducing hours below a certain threshold and workers are heterogeneous, employers are more likely to prefer temporary layoffs than short-time working. Adverse selection and moral hazard in the employment relationship would also make the firms more prone to the use of dismissals and temporary layoffs.
iii) Workers are assumed to have a utility function which ranks preferences over consumption and leisure. In other words, there is disutility of work. Thus, given earnings, workers are better-off under temporary layoffs than under short-time working, and better under short-time working than under full-time working. However, it could be argued that workers derive utility from having a full-time "regular" job instead of "unstable" part-time jobs (Drèze (1987). And, as already commented, temporary layoffs may be perceived as the first step toward complete dismissals. Then, dismissals of part of the labor force can be preferred by workers to either temporary layoffs or short-time working.
iv) All workers are employed under the same contract which imposes the same severance payments in case of dismissals. Thus, the marginal cost of dismissals is taken to be constant by assumption. However, severance payments are usually linked to seniority, so that, their marginal cost is increasing in the number of dismissals. This implies some non-linearities in the decision to resource to temporary layoffs and short-time working: for small workforce adjustment, dismissals may be less expensive than temporary layoffs and short-time working, so that internal workforce adjustment will take place only after large shocks. This distinction in the firing costs among workers is very relevant to the Spanish case, where a significant proportion of workers are employed under fixed-term contracts which do not entail significant firing costs. It also suggests some questions about the actual utility function of the workers bargaining with the firm. It is very likely than these are more senior workers, permanent workers which do not fully represent the interests of the junior, fixed-term employees. If so, external workforce adjustment would be much more likely than internal workforce adjustments.
v) Finally, the whole analysis is carried out on pure static grounds, although dynamic considerations are crucial in this issue. First, it is clear than the nature of the adverse shock affects both the private decisions about adjustments, and the convenience of such adjustments from a social point of view. If the shock is transitory, temporary layoffs and short-time working are likely. Anyway, under efficient bargaining, employment contracts are designed to take care of transitory shocks. However, if the shock is permanent, temporary layoffs do not solve the problem, and general equilibrium considerations play a role: It may be the case that the utility of workers under temporary layoffs or under short-time working scheme is below the alternative utility that they may achieve in other activities. Second, insider and membership effects are to be taken into account by employers and firms when deciding the combination of employment and working hours. While a group of workers may prefer dismissals, so that in the future rents are to be enjoyed by a lower number of workers, firms may want temporary layoffs and short-time working, so that employment relationships are maintained and in the future there will be lower wage pressure. As for social welfare is concerned, it is clear that internal adjustment to transitory shocks could be desirable, to mitigate insider effects, while, by an efficient allocation of resources argument, external adjustment to permanent shocks produces better outcomes. Distributional considerations could also be mentioned to shift the balance toward internal adjustment. However, in the case of adjustment to permanent shocks, it is clear that there are much less perverse ways of redistributing than by short-time working schemes that preclude an efficient allocation of resources.
Thus, on balance, it seems that the conditions required by short-time working to be a major source of internal workforce adjustment are rather strong. In particular, technological constraints on the tradeoffs between hours and number of workers, efficient bargaining, relative generous compensations for short-time working, and lack of segmentation of the workforce by types of employment and seniority are close to be necessary for internal workforce adjustment to take place as varying working hours. Even in this case, a short-time compensation more generous than the unemployment benefit system is likely to be required. In the Spanish case, these three conditions are very far to be satisfied. Bargaining is mostly at the sectoral level (see Jimeno and Toharia (1994b), chapter 3), there are not special provisions for short-time working (section 2) and the labor market is segmented between permanent/protected workers and fixed-term/unprotected workers . Further research on this topic should concentrate on the relative importance of each of the above constraints to short-time working schemes, and on the social costs and benefits of government intervention in this type of arrangements.
Dolado and Bentolila (1993) estimate a wage determination model with insider effects and cannot reject the hypothesis that, in Spanish manufacturing firms, permanent workers are the insiders while the interest of fixed-term workers is not taken into consideration when bargaining.
References
- Burdett, K. and R. Wright (1989), "Unemployment Insurance and Short-Time Compensation: The Effects on Layoffs, Hours per Worker, and Wages", Journal of Political Economy, vol. 97, 6, pp. 1479-1496.
- Dolado, J.J. and S. Bentolila (1993), "Who are the insiders? Wage Setting in Spanish Manufacturing Firms", CEPR Discussion Paper no. 754.
- Drèze, J. (1987), "Work-Sharing: Why? How? How not", in R. Layard and L. Calmfors, ed., The Fight Against Unemployment, Cambridge, Mass: The MIT Press.
- Jimeno, J.F. and L. Toharia (1994a), "The management of redundancies in Spain: Economic report", Documento de Trabajo, FEDEA, 94-04, May (originally presented at the International Forum on Income Protection Systems in case of Unemployment and the Management of Redundancies in Europe", organised by the CNEL, Rome, December 1993).
- Jimeno, J.F. and L. Toharia (1994b), Unemployment and Labour Market Flexibility: Spain, International Labour Office, Geneva.
- Segura, J., F. Durán, L. Toharia and S. Bentolila (1991), "Análisis de la contratación temporal en España", Madrid: Ministerio de Trabajo y Seguridad Social.
- Van Audenrode, M. (1994), "Short-Time Compensation, Job Security, and Employment Contracts: Evidence from Selected OECD countries", Journal of Political Economy, vol.102,1, pp.76-102.
- Wright, R. and J. Hotchkiss (1988), "A General Model of Unemployment Insurance with and without Short-Time Compensation", in R.G. Ehrenberg, ed., Research in Labor Economics, vol. 9, Greenwich, Conn.: JAI.
Table 1. Average annual number of working hours, 1970-1990. Source: OECD, 1991.
| ALL WORKERS | 1970 | 1973 | 1975 | 1979 | 1983 | 1988 | 1990 | 1970-79 | 1979-90 |
| Canada | 1890 | 1865 | 1837 | 1794 | 1730 | 1760 | 1734 | -5.1 | -3.3 |
| Finland | 1982 | 1915 | 1885 | 1859 | 1798 | 1783 | 1756 | -6.2 | -5.5 |
| France | 1962 | 1904 | 1865 | 1817 | 1717 | 1690 | 1678 | -7.4 | -7.6 |
| Italy | 1969 | 1885 | 1841 | 1788 | 1764 | -9.2 | |||
| Japan | 2185 | 2100 | 2110 | 2081 | 2078 | -3.4 | -1.5 | ||
| Norway | 1766 | 1694 | 1653 | 1501 | 1471 | 1429 | 1417 | -15.0 | -5.6 |
| Spain | 2148 | 2052 | 1934 | 1941 | -9.6 | ||||
| Sweden | 1641 | 1557 | 1516 | 1451 | 1453 | 1485 | 1480 | -11.6 | 2.0 |
| United States | 1886 | 1875 | 1833 | 1808 | 1788 | 1785 | 1782 | -4.1 | -1.4 |
| EMPLOYEES | |||||||||
| France | 1821 | 1771 | 1720 | 1667 | 1558 | 1547 | 1539 | -8.5 | -7.7 |
| Germany | 1885 | 1804 | 1737 | 1699 | 1670 | 1623 | 1589 | -9.9 | -6.5 |
| Netherlands | 1591 | 1530 | 1450 | 1433 | -9.9 | ||||
| Spain | 2032 | 1946 | 1843 | 1858 | -8.6 | ||||
| United States | 1836 | 1831 | 1791 | 1767 | 1754 | 1750 | 1750 | -3.8 | -1.0 |
Table 2. Average weekly number of working hours, different countries, 1991. Source: National Labour Force Surveys.
| Agric. | Manuf. | Serv. | Total | |
| Belgium | 36.7 | 38.2 | 34.3 | 35.6 |
| Denmark | 35.7 | 35.4 | 33.1 | 33.8 |
| Germany | 39.9 | 37.8 | 35.7 | 36.6 |
| Greece | 45.3 | 40.6 | 39.1 | 39.7 |
| Spain | 43.3 | 40.3 | 38.8 | 39.6 |
| France | 39.4 | 39.5 | 36.6 | 37.6 |
| Ireland | 48.2 | 40.2 | 37.2 | 38.6 |
| Italy | 38.9 | 40.1 | 36.8 | 38.0 |
| Luxembourg | 44.7 | 39.9 | 37.7 | 38.4 |
| Netherlands | 32.5 | 35.6 | 30.2 | 31.7 |
| Portugal | 46.3 | 42.9 | 38.9 | 40.9 |
| UK | 43.6 | 41.6 | 35.2 | 37.3 |
Table 3. Workers with fixed-term contracts (total in thousands and proportion out of total wage workers), Spain 1987-1994. Source: Labour Force Survey.
| EMPLOYEES | FIXED-TERM CONTRACTS | ||||||
| Total | Seasonal | Others | %Total | %Seasonal | %Others | ||
| 1987 | 7877.1 | 1225.8 | 546.4 | 679.4 | 15.6 | 6.9 | 8.6 |
| 1988 | 8284.9 | 1851.3 | 608.5 | 1242.8 | 22.3 | 7.3 | 15.0 |
| 1989 | 8802.5 | 2334.7 | 584.6 | 1750.1 | 26.5 | 6.6 | 19.9 |
| 1990 | 9230.0 | 2750.4 | 553.1 | 2197.3 | 29.8 | 6.0 | 23.8 |
| 1991 | 9384.0 | 3018.9 | 550.2 | 2468.7 | 32.2 | 5.9 | 26.3 |
| 1992 | 9144.3 | 3063.0 | 739.2 | 2323.8 | 33.5 | 8.1 | 25.4 |
| 1993 | 8699.8 | 2796.3 | 678.3 | 2118.0 | 32.1 | 7.8 | 24.3 |
| 1994 | 8609.0 | 2896.4 | 798.9 | 2097.5 | 33.6 | 9.3 | 24.4 |
Table 4. Workers with fixed-term contracts by sectors, Spain 1987 and 1992. Source: LFS.
| %FIXED-TERM WORKERS/EMPLOYEES | 1987 | 1992 | ||||
| 1987 | 1992 | EMPLOYEES | FIXED-TERM | EMPLOYEES | FIXED-TERM | |
| Agriculture | 39.3 | 57.6 | 525.9 | 206.7 | 397.7 | 229.1 |
| Energy & Water | 4.3 | 8.4 | 135.4 | 5.8 | 117.8 | 9.9 |
| Extraction | 8.2 | 24.1 | 371 | 30.4 | 386.8 | 93.4 |
| Production | 7.8 | 25.3 | 756.3 | 59.2 | 835.7 | 211.2 |
| Other manuf. | 15.3 | 34.2 | 1132.3 | 173.4 | 1124.9 | 384.4 |
| Construction | 29.3 | 59.1 | 682.3 | 199.8 | 924.3 | 546.5 |
| Trade | 18.2 | 41.2 | 1256.2 | 229.1 | 1568.7 | 647 |
| Transports | 7.8 | 20.9 | 446.8 | 34.7 | 530.8 | 110.7 |
| Finance | 8.5 | 28.0 | 437.9 | 37.1 | 600.7 | 168.2 |
| Ot.Services | 11.7 | 24.9 | 2133 | 249.7 | 2656.9 | 662.6 |
| TOTAL | 15.6 | 33.5 | 7877.1 | 1225.9 | 9144.3 | 3063.0 |
Table 5. Workers with part-time contracts (proportion out of total employment) by sectors, Spain 1987, 1990 and 1992. Source: Labour Force Survey.
| 1987 | 1990 | 1992 | |
| Agriculture | 6.8 | 6.0 | 6.4 |
| Energy & water | 0.7 | 0.6 | 0.3 |
| Extraction | 1.7 | 0.9 | 1.1 |
| Production | 1.2 | 0.8 | 1.0 |
| Other manuf. | 4.1 | 3.0 | 4.0 |
| Construction | 1.3 | 0.9 | 0.8 |
| Trade | 5.8 | 4.8 | 5.7 |
| Transports | 1.5 | 1.9 | 2.1 |
| Financial serv. | 3.8 | 4.3 | 5.1 |
| Other services | 12.0 | 10.7 | 12.3 |
| TOTAL | 5.8 | 4.9 | 5.8 |
FEDEA - D.T. 95-01 by C.García-Serrano, J. F. Jimeno, L. Toharia Table 6. Number of EREs (Spain, 1977-1993).
| FORM OF ADJUSTMENT | INDUSTY | FIRM'S SIZE | TOTAL | ||||||||||||
| TEMP. LAYOFF | REDUCT. HOURS | PERM. LAYOFF | AGRIC. | MANUF. | CONSTR. | SERV. | 1-25 | 26-50 | 51-100 | 101-500 | 501-1000 | 1001-5000 | +5000 | ||
| 1977 | 2533 | 732 | 3790 | 316 | 3909 | 1009 | 1821 | 5147 | 842 | 492 | 473 | 54 | 37 | 10 | 7055 |
| 1978 | 3669 | 1060 | 5489 | 318 | 5924 | 1535 | 2441 | 7043 | 1388 | 751 | 840 | 91 | 96 | 9 | 10218 |
| 1979 | 5570 | 1426 | 6679 | 896 | 7600 | 2297 | 2882 | 9561 | 1765 | 977 | 1081 | 127 | 153 | 11 | 13675 |
| 1980 | 8628 | 2660 | 4244 | 706 | 9456 | 2434 | 2936 | 9807 | 2423 | 1492 | 1457 | 168 | 156 | 29 | 15532 |
| 1981 | 7431 | 2256 | 3866 | 1266 | 7712 | 1985 | 2590 | 8303 | 2082 | 1295 | 1450 | 220 | 191 | 12 | 13553 |
| 1982 | 6560 | 1787 | 3769 | 785 | 6744 | 1546 | 3041 | 7144 | 1629 | 1132 | 1385 | 271 | 299 | 205 | 12116 |
| 1983 | 9305 | 1555 | 4228 | 1414 | 8130 | 1230 | 4314 | 9262 | 1764 | 1318 | 1724 | 354 | 343 | 279 | 15088 |
| 1984 | 7720 | 1630 | 4896 | 1520 | 8224 | 1192 | 3310 | 8482 | 1643 | 1210 | 1494 | 421 | 467 | 484 | 14246 |
| 1985 | 7914 | 1275 | 5776 | 1994 | 8007 | 1136 | 3828 | 9843 | 1694 | 1098 | 1356 | 294 | 363 | 307 | 14965 |
| 1986 | 8017 | 642 | 5227 | 2134 | 7860 | 751 | 3141 | 9462 | 1473 | 774 | 1267 | 261 | 260 | 389 | 13886 |
| 1987 | 6346 | 478 | 4346 | 1695 | 6323 | 497 | 2655 | 7444 | 1119 | 596 | 1006 | 244 | 313 | 448 | 11170 |
| 1988 | 5853 | 336 | 4036 | 2268 | 5172 | 355 | 2430 | 7099 | 884 | 566 | 821 | 155 | 293 | 407 | 10225 |
| 1989 | 4696 | 210 | 3816 | 2271 | 3994 | 210 | 2247 | 6249 | 717 | 395 | 628 | 105 | 232 | 396 | 8722 |
| 1990 | 5010 | 297 | 4180 | 2134 | 4610 | 315 | 2428 | 6594 | 795 | 560 | 790 | 192 | 265 | 291 | 9487 |
| 1991 | 5812 | 451 | 5608 | 2333 | 5989 | 320 | 3229 | 8160 | 1029 | 703 | 1012 | 264 | 204 | 499 | 11871 |
| 1992 | 5689 | 494 | 7273 | 2092 | 6809 | 635 | 3920 | 9707 | 1054 | 759 | 1202 | 164 | 323 | 247 | 13456 |
| 1993 | 8215 | 1170 | 13611 | 2084 | 11024 | 1584 | 8304 | 17347 | 1827 | 1162 | 1598 | 264 | 294 | 504 | 22996 |
FEDEA - D.T. 95-01 by C.García-Serrano, J. F. Jimeno, L. Toharia Table 7. Total number of workers affected by EREs, by form of adjustment, industry and firm's size (Spain 1977-1993).
| FORM OF ADJUSTMENT | INDUSTRY | FIRM'S SIZE | TOTAL | ||||||||||||
| TEMP. LAYOFF | SHORT HOURS | PERM. LAYOFF | AGRIC. | MANUF. | CONST. | SERV. | 1-25 | 26-50 | 51-100 | 101-500 | 501-1000 | 1001-5000 | +5000 | ||
| 1977 | 76161 | 28233 | 54786 | - | - | - | - | - | - | - | - | - | - | - | 159180 |
| 1978 | 114135 | 95759 | 66207 | - | - | - | - | - | - | - | - | - | - | - | 276101 |
| 1979 | 152471 | 105343 | 75055 | 20101 | 250145 | 34005 | 28618 | 68037 | 45351 | 47338 | 107724 | 23825 | 39597 | 997 | 332869 |
| 1980 | 256675 | 171389 | 60222 | 16365 | 381563 | 41804 | 48554 | 73177 | 62854 | 70666 | 152500 | 35477 | 60657 | 32955 | 488286 |
| 1981 | 240894 | 179250 | 57454 | 29746 | 381524 | 24440 | 41888 | 62550 | 51975 | 55943 | 148440 | 53736 | 75334 | 29620 | 477598 |
| 1982 | 239473 | 153918 | 61805 | 18644 | 340959 | 26246 | 69347 | 49629 | 39239 | 48859 | 138074 | 51558 | 88109 | 37904 | 455196 |
| 1983 | 369815 | 178990 | 59984 | 23140 | 490446 | 16278 | 78925 | 63909 | 44109 | 61423 | 161990 | 66921 | 119977 | 89585 | 608789 |
| 1984 | 407453 | 218240 | 68990 | 23293 | 608158 | 14934 | 48298 | 62542 | 40979 | 52230 | 140861 | 66599 | 113969 | 215160 | 694683 |
| 1985 | 362351 | 156267 | 74776 | 27584 | 496355 | 11510 | 57945 | 68801 | 40896 | 46712 | 125994 | 56819 | 89649 | 162714 | 593394 |
| 1986 | 259919 | 87562 | 56882 | 25415 | 333580 | 6583 | 38785 | 64746 | 29265 | 25791 | 87608 | 51069 | 70261 | 75623 | 404363 |
| 1987 | 230784 | 47763 | 48166 | 20007 | 261885 | 4203 | 40618 | 49626 | 22923 | 21168 | 70825 | 54554 | 75118 | 32501 | 326713 |
| 1988 | 214121 | 34855 | 56753 | 26210 | 238606 | 3432 | 37481 | 48925 | 19005 | 19802 | 62962 | 31023 | 71015 | 52997 | 305729 |
| 1989 | 146517 | 23065 | 46322 | 26436 | 165769 | 1895 | 21804 | 44288 | 15397 | 14360 | 46140 | 26776 | 52131 | 16812 | 215904 |
| 1990 | 257033 | 28837 | 48591 | 22979 | 283059 | 4300 | 24123 | 45756 | 18321 | 20985 | 63934 | 30560 | 50021 | 104884 | 334461 |
| 1991 | 213744 | 37558 | 68032 | 24890 | 250947 | 3081 | 40416 | 53426 | 22439 | 26896 | 85033 | 23189 | 38497 | 64892 | 319334 |
| 1992 | 233805 | 24565 | 83237 | 22091 | 284496 | 5878 | 29142 | 60099 | 22749 | 27205 | 83404 | 26670 | 47160 | 69935 | 341607 |
| 1993 | 392139 | 47263 | 118744 | 23166 | 469702 | 12486 | 52792 | 93424 | 36114 | 41123 | 133260 | 41230 | 79544 | 128103 | 558146 |
Table 8. Average number of workers affected by EREs (Spain, 1977-1993). FEDEA - D.T. 95-01 by C.García-Serrano, J. F. Jimeno, L. Toharia
| FORM OF ADJUSTMENT | INDUSTRY | FIRM'S SIZE | TOTAL | ||||||||||||
| TEMP. LAYOFF | SHORT HOURS | PERM. LAYOFF | AGRIC. | MANUF. | CONST. | SERV. | 1-25 | 26-50 | 51-100 | 101-500 | 501-1000 | 1001-5000 | +5000 | ||
| 1977 | 30 | 39 | 14 | - | - | - | - | - | - | - | - | - | - | - | 23 |
| 1978 | 31 | 90 | 12 | - | - | - | - | - | - | - | - | - | - | - | 27 |
| 1979 | 27 | 74 | 11 | 22 | 33 | 15 | 10 | 7 | 26 | 48 | 100 | 188 | 259 | 91 | 24 |
| 1980 | 30 | 64 | 14 | 23 | 40 | 17 | 17 | 7 | 26 | 47 | 105 | 211 | 389 | 1136 | 31 |
| 1981 | 32 | 79 | 15 | 23 | 49 | 12 | 16 | 8 | 25 | 43 | 102 | 244 | 394 | 2468 | 35 |
| 1982 | 37 | 86 | 16 | 24 | 51 | 17 | 23 | 7 | 24 | 43 | 100 | 190 | 295 | 185 | 38 |
| 1983 | 40 | 115 | 14 | 16 | 60 | 13 | 18 | 7 | 25 | 47 | 94 | 189 | 350 | 321 | 40 |
| 1984 | 53 | 134 | 14 | 15 | 74 | 13 | 15 | 7 | 25 | 43 | 94 | 158 | 244 | 445 | 49 |
| 1985 | 46 | 123 | 13 | 14 | 62 | 10 | 15 | 7 | 24 | 43 | 93 | 193 | 247 | 530 | 40 |
| 1986 | 32 | 136 | 11 | 12 | 42 | 9 | 12 | 7 | 20 | 33 | 69 | 196 | 270 | 194 | 29 |
| 1987 | 36 | 100 | 11 | 12 | 41 | 8 | 15 | 7 | 20 | 36 | 70 | 224 | 240 | 73 | 29 |
| 1988 | 37 | 104 | 14 | 12 | 46 | 10 | 15 | 7 | 21 | 35 | 77 | 200 | 242 | 130 | 30 |
| 1989 | 31 | 110 | 12 | 12 | 42 | 9 | 10 | 7 | 21 | 36 | 73 | 255 | 225 | 42 | 25 |
| 1990 | 51 | 97 | 12 | 11 | 61 | 14 | 10 | 7 | 23 | 37 | 81 | 159 | 189 | 360 | 35 |
| 1991 | 37 | 83 | 12 | 11 | 42 | 10 | 13 | 7 | 22 | 38 | 84 | 88 | 189 | 130 | 27 |
| 1992 | 41 | 50 | 11 | 11 | 42 | 9 | 7 | 6 | 22 | 36 | 69 | 163 | 146 | 283 | 25 |
| 1993 | 48 | 40 | 9 | 11 | 43 | 8 | 6 | 5 | 20 | 35 | 83 | 156 | 271 | 254 | 24 |
Table 9. Distribution of the forms of adjustment by industries (Spain, 1979-1993). FEDEA - D.T. 95-01 by C.García-Serrano, J. F. Jimeno, L. Toharia
| TEMPORARY LAYOFFS | SHORT-TIME | FIRINGS | ||||||||||
| AGRIC. | MANUF. | CONSTR. | SERV. | AGRIC. | MANUF. | CONSTR. | SERV. | AGRIC. | MANUF. | CONSTR. | SERV. | |
| 1979 | 12.7 | 65.6 | 11.3 | 10.4 | 0.0 | 92.9 | 3.9 | 3.2 | 0.9 | 69.7 | 16.9 | 12.4 |
| 1980 | 6.0 | 70.9 | 10.2 | 12.9 | 0.1 | 92.5 | 3.7 | 3.8 | 1.4 | 68.2 | 15.5 | 14.9 |
| 1981 | 11.9 | 70.4 | 5.4 | 12.3 | 0.1 | 95.7 | 1.7 | 2.5 | 1.7 | 70.3 | 14.4 | 13.5 |
| 1982 | 7.2 | 63.4 | 6.6 | 22.8 | 0.2 | 94.6 | 1.7 | 3.5 | 1.7 | 70.4 | 12.6 | 15.2 |
| 1983 | 5.9 | 73.8 | 2.4 | 17.9 | 0.1 | 97.3 | 0.4 | 2.2 | 1.9 | 72.5 | 11.1 | 14.5 |
| 1984 | 5.4 | 84.1 | 1.5 | 9.0 | 0.0 | 98.0 | 0.9 | 1.0 | 1.8 | 74.5 | 9.7 | 13.9 |
| 1985 | 7.2 | 79.8 | 1.3 | 11.7 | 0.1 | 98.5 | 0.2 | 1.2 | 1.7 | 71.4 | 8.6 | 18.3 |
| 1986 | 9.4 | 80.1 | 1.0 | 9.5 | 0.1 | 97.0 | 0.1 | 2.8 | 1.5 | 71.3 | 6.8 | 20.4 |
| 1987 | 8.3 | 77.6 | 1.0 | 13.2 | 0.0 | 95.2 | 0.0 | 4.8 | 2.0 | 77.7 | 3.9 | 16.4 |
| 1988 | 11.9 | 77.5 | 0.8 | 9.8 | 0.0 | 97.3 | 0.1 | 2.6 | 1.5 | 68.2 | 2.9 | 27.4 |
| 1989 | 17.5 | 73.2 | 0.8 | 8.6 | 0.1 | 98.9 | 0.0 | 1.0 | 1.8 | 77.1 | 1.6 | 19.5 |
| 1990 | 8.6 | 83.9 | 1.2 | 6.2 | 0.0 | 98.7 | 0.0 | 1.3 | 1.6 | 80.2 | 2.3 | 15.9 |
| 1991 | 11.1 | 76.6 | 0.5 | 11.9 | 0.0 | 98.2 | 0.0 | 1.8 | 1.7 | 74.1 | 3.0 | 21.1 |
| 1992 | 8.9 | 84.8 | 1.2 | 5.2 | 0.1 | 97.5 | 0.3 | 2.1 | 1.6 | 74.8 | 3.7 | 19.9 |
| 1993 | 5.4 | 89.0 | 1.1 | 4.6 | 0.1 | 94.8 | 0.7 | 4.4 | 1.6 | 64.0 | 6.7 | 27.7 |
Table 10. Distribution of the forms of adjustment by firm's size (Spain, 1979-1994). FEDEA - D.T. 95-01 by C.García-Serrano, J. F. Jimeno, L. Toharía
| TEMPORARY LAYOFFS | SHORT-TIME | FIRINGS | |||||||||||||||||||
| 1-25 | 26-50 | 51-100 | 101-500 | 501-1000 | 1001-5000 | +5000 | 1-25 | -24 | 51-100 | 101-500 | 501-1000 | 1001-5000 | +5000 | 1-25 | 26-50 | 51-100 | 101-500 | 501-1000 | 1001-5000 | +5000 | |
| 1979 | 22.2 | 16.5 | 15.5 | 32.9 | 4.6 | 8.0 | 0.2 | 6.8 | 6.8 | 11.5 | 37.5 | 13.4 | 23.9 | 0.0 | 35.9 | 17.3 | 15.3 | 23.9 | 3.6 | 3.0 | 0.8 |
| 1980 | 16.3 | 15.5 | 15.4 | 29.0 | 6.2 | 10.1 | 7.5 | 7.6 | 6.7 | 11.8 | 36.2 | 10.5 | 19.4 | 7.8 | 30.3 | 19.2 | 18.1 | 26.9 | 2.4 | 2.4 | 0.7 |
| 1981 | 15.3 | 13.0 | 13.2 | 30.5 | 11.8 | 9.7 | 6.7 | 5.5 | 5.3 | 7.5 | 32.7 | 13.3 | 28.3 | 7.4 | 27.5 | 19.4 | 18.9 | 28.6 | 2.5 | 2.5 | 0.6 |
| 1982 | 11.8 | 10.1 | 11.9 | 31.1 | 13.2 | 18.8 | 2.5 | 4.6 | 4.5 | 7.5 | 29.4 | 10.9 | 24.8 | 18.3 | 23.1 | 13.4 | 14.4 | 29.8 | 5.3 | 7.8 | 6.0 |
| 1983 | 11.7 | 8.1 | 11.3 | 27.8 | 12.4 | 17.6 | 11.1 | 3.2 | 3.4 | 5.9 | 25.3 | 8.6 | 27.8 | 25.8 | 25.2 | 13.3 | 15.4 | 23.4 | 9.8 | 8.4 | 4.3 |
| 1984 | 9.4 | 6.6 | 7.8 | 18.6 | 9.6 | 13.1 | 34.4 | 2.6 | 2.1 | 5.1 | 22.2 | 10.5 | 25.2 | 32.1 | 26.6 | 13.6 | 13.5 | 24.2 | 6.4 | 8.3 | 7.1 |
| 1985 | 11.9 | 7.5 | 8.8 | 21.8 | 9.3 | 13.1 | 27.1 | 2.9 | 2.7 | 4.0 | 19.1 | 12.1 | 21.7 | 37.6 | 28.3 | 12.5 | 11.5 | 22.9 | 5.6 | 11.3 | 7.9 |
| 1986 | 17.0 | 8.3 | 6.5 | 22.1 | 14.7 | 15.0 | 16.4 | 2.9 | 1.6 | 2.7 | 18.5 | 10.6 | 33.0 | 30.9 | 31.6 | 11.3 | 11.3 | 24.6 | 6.4 | 4.2 | 10.6 |
| 1987 | 14.8 | 7.0 | 5.8 | 20.8 | 20.7 | 20.1 | 10.7 | 3.3 | 3.0 | 4.2 | 22.2 | 7.2 | 52.4 | 7.7 | 28.9 | 11.0 | 11.9 | 25.4 | 6.8 | 7.6 | 8.5 |
| 1988 | 16.2 | 6.3 | 5.8 | 20.4 | 11.9 | 23.0 | 16.5 | 3.6 | 2.4 | 4.7 | 27.5 | 7.4 | 47.7 | 6.7 | 23.1 | 8.2 | 10.2 | 17.0 | 5.2 | 9.2 | 27.1 |
| 1989 | 20.3 | 7.4 | 6.1 | 20.2 | 16.3 | 23.3 | 6.5 | 3.2 | 1.9 | 4.1 | 25.7 | 1.4 | 61.3 | 2.4 | 30.0 | 8.9 | 9.6 | 22.8 | 5.7 | 8.3 | 14.7 |
| 1990 | 11.4 | 4.6 | 5.4 | 19.0 | 11.0 | 13.2 | 35.4 | 3.8 | 3.6 | 7.1 | 18.4 | 2.4 | 26.3 | 38.5 | 31.5 | 11.2 | 10.6 | 20.0 | 3.5 | 17.6 | 5.5 |
| 1991 | 14.6 | 6.7 | 7.8 | 27.4 | 9.7 | 13.7 | 20.1 | 5.0 | 3.3 | 3.5 | 29.6 | 6.5 | 12.2 | 39.7 | 30.0 | 10.1 | 13.1 | 22.5 | 0.0 | 6.7 | 10.3 |
| 1992 | 13.2 | 5.5 | 7.2 | 25.8 | 10.7 | 11.2 | 26.5 | 9.2 | 4.1 | 5.0 | 21.4 | 6.6 | 53.7 | 0.0 | 32.5 | 10.7 | 10.9 | 21.5 | 0.0 | 9.5 | 9.6 |
| 1993 | 10.2 | 5.3 | 6.9 | 26.4 | 9.4 | 14.4 | 27.4 | 11.0 | 5.6 | 6.0 | 17.9 | 9.6 | 34.7 | 15.2 | 40.6 | 10.6 | 9.5 | 18.1 | 0.0 | 5.5 | 11.2 |
Table 11. Incidence of the EREs, by form of adjustment and industries (over total wage workers). Spain, 1977-1993. FEDEA - D.T. 95-01 by C.García-Serrano, J. F. Jimeno, L. Toharia
| FORM OF ADJUSTMENT | INDUSTRY | TOTAL | ||||||
| TEMP. LAYOFFS | SHORT-TIME | FIRINGS | AGRIC. | MANUFAC. | CONSTR. | SERV. | ||
| 1977 | 0.87 | 0.32 | 0.63 | - | - | - | - | 1.83 |
| 1978 | 1.33 | 1.12 | 0.77 | - | - | - | - | 3.23 |
| 1979 | 1.82 | 1.26 | 0.90 | 3.05 | 8.50 | 3.67 | 0.75 | 3.98 |
| 1980 | 3.18 | 2.12 | 0.75 | 2.71 | 13.56 | 4.89 | 1.28 | 6.05 |
| 1981 | 3.09 | 2.30 | 0.74 | 5.18 | 14.23 | 3.16 | 1.11 | 6.12 |
| 1982 | 3.09 | 1.99 | 0.80 | 3.26 | 13.42 | 3.43 | 1.79 | 5.87 |
| 1983 | 4.83 | 2.34 | 0.78 | 4.05 | 19.96 | 2.24 | 2.03 | 7.96 |
| 1984 | 5.57 | 2.98 | 0.94 | 4.45 | 25.64 | 2.48 | 1.26 | 9.49 |
| 1985 | 4.96 | 2.14 | 1.02 | 4.95 | 21.58 | 2.09 | 1.49 | 8.12 |
| 1986 | 3.39 | 1.14 | 0.74 | 4.79 | 14.25 | 1.08 | 0.93 | 5.28 |
| 1987 | 2.89 | 0.60 | 0.60 | 3.75 | 10.88 | 0.61 | 0.94 | 4.10 |
| 1988 | 2.56 | 0.42 | 0.68 | 4.84 | 9.71 | 0.44 | 0.82 | 3.66 |
| 1989 | 1.65 | 0.26 | 0.52 | 5.42 | 6.49 | 0.21 | 0.44 | 2.43 |
| 1990 | 2.77 | 0.31 | 0.52 | 4.87 | 10.77 | 0.45 | 0.46 | 3.61 |
| 1991 | 2.28 | 0.40 | 0.73 | 5.36 | 9.87 | 0.31 | 0.75 | 3.41 |
| 1992 | 2.58 | 0.27 | 0.92 | 5.52 | 11.75 | 0.65 | 0.54 | 3.76 |
| 1993 | 4.51 | 0.54 | 1.37 | 6.24 | 21.38 | 1.54 | 0.99 | 6.43 |
Table 12. Incidence of the EREs by form of adjustment (and industry) over employees. Spain, 1979-1993. FEDEA - D.T. 95-01 by C.García-Serrano, J. F. Jimeno, L. Toharia
| TEMPORARY LAYOFFS | SHORT-TIME | FIRINGS | ||||||||||
| AGRIC. | MANUF. | CONSTR. | SERV. | AGRIC. | MANUF. | CONSTR. | SERV. | AGRIC. | MANUF. | CONSTR. | SERV. | |
| 1979 | 2.94 | 3.40 | 1.86 | 0.42 | 0.01 | 3.33 | 0.44 | 0.09 | 0.10 | 1.78 | 1.37 | 0.24 |
| 1980 | 2.54 | 6.47 | 3.07 | 0.87 | 0.03 | 5.63 | 0.73 | 0.17 | 0.14 | 1.46 | 1.09 | 0.24 |
| 1981 | 4.98 | 6.32 | 1.70 | 0.79 | 0.03 | 6.40 | 0.39 | 0.12 | 0.17 | 1.51 | 1.07 | 0.21 |
| 1982 | 3.02 | 5.97 | 2.07 | 1.41 | 0.05 | 5.73 | 0.35 | 0.14 | 0.19 | 1.71 | 1.02 | 0.24 |
| 1983 | 3.83 | 11.10 | 1.22 | 1.70 | 0.02 | 7.09 | 0.11 | 0.10 | 0.20 | 1.77 | 0.91 | 0.22 |
| 1984 | 4.19 | 14.45 | 1.03 | 0.96 | 0.02 | 9.02 | 0.34 | 0.06 | 0.24 | 2.17 | 1.12 | 0.25 |
| 1985 | 4.69 | 12.57 | 0.86 | 1.09 | 0.02 | 6.70 | 0.06 | 0.05 | 0.23 | 2.32 | 1.16 | 0.35 |
| 1986 | 4.61 | 8.89 | 0.43 | 0.59 | 0.02 | 3.63 | 0.01 | 0.06 | 0.16 | 1.73 | 0.64 | 0.28 |
| 1987 | 3.57 | 7.44 | 0.33 | 0.70 | 0.00 | 1.89 | 0.00 | 0.05 | 0.18 | 1.55 | 0.27 | 0.18 |
| 1988 | 4.69 | 6.75 | 0.23 | 0.46 | 0.00 | 1.38 | 0.00 | 0.02 | 0.15 | 1.57 | 0.21 | 0.34 |
| 1989 | 5.24 | 4.20 | 0.13 | 0.25 | 0.00 | 0.89 | 0.00 | 0.00 | 0.17 | 1.40 | 0.08 | 0.18 |
| 1990 | 4.70 | 8.21 | 0.33 | 0.31 | 0.00 | 1.08 | 0.00 | 0.01 | 0.17 | 1.48 | 0.12 | 0.15 |
| 1991 | 5.10 | 6.44 | 0.10 | 0.47 | 0.00 | 1.45 | 0.00 | 0.01 | 0.25 | 1.98 | 0.21 | 0.27 |
| 1992 | 5.18 | 8.19 | 0.30 | 0.23 | 0.01 | 0.99 | 0.01 | 0.01 | 0.33 | 2.57 | 0.34 | 0.31 |
| 1993 | 5.70 | 15.88 | 0.51 | 0.34 | 0.01 | 2.04 | 0.04 | 0.04 | 0.53 | 3.46 | 0.98 | 0.62 |
FEDEA - D.T. 95-01 by C.García-Serrano, J. F. Jimeno, L. Toharia Table 13. Incidence of temporary layoffs by manufacturing subsectors (Spain, 1981-1992).
| COAL | OIL | ELEC | MINE | META | NO.MET | CHEM | P.MET | EQUIP | M.ELEC | TRONIC | |
| 1981 | 396 | 0.22 | 0.17 | 6.10 | 5.90 | 1.75 | 2.63 | 16.65 | 5.16 | 4.57 | 2.22 |
| 1982 | 4.27 | 0.62 | 0.16 | 8.23 | 7.60 | 3.88 | 3.12 | 12.91 | 3.96 | 16.27 | 2.45 |
| 1983 | 5.50 | 0.42 | 0.29 | 4.65 | 9.88 | 3.20 | 5.55 | 22.06 | 9.59 | 20.94 | 1.42 |
| 1984 | 19.61 | 0.03 | 0.11 | 2.54 | 10.18 | 2.31 | 0.93 | 11.62 | 8.92 | 23.50 | 10.79 |
| 1985 | 3.54 | 0.03 | 0.14 | 3.74 | 8.83 | 4.47 | 1.17 | 12.42 | 9.34 | 24.79 | 8.12 |
| 1986 | 7.02 | 1.24 | 0.04 | 6.95 | 8.49 | 2.72 | 0.81 | 18.57 | 12.17 | 9.34 | 6.54 |
| 1987 | 20.22 | 0.51 | 0.10 | 10.32 | 4.60 | 2.44 | 0.45 | 18.54 | 7.34 | 12.80 | 13.39 |
| 1988 | 4.87 | 0.00 | 0.07 | 3.69 | 7.17 | 2.32 | 0.23 | 11.14 | 8.62 | 15.60 | 6.12 |
| 1989 | 2.54 | 1.17 | 0.05 | 5.39 | 2.31 | 1.50 | 1.01 | 5.56 | 9.03 | 15.44 | 4.21 |
| 1990 | 17.25 | 0.00 | 0.04 | 5.76 | 5.84 | 1.53 | 1.46 | 10.43 | 4.90 | 8.00 | 5.67 |
| 1991 | 38.31 | 0.80 | 0.01 | 5.84 | 3.23 | 1.72 | 1.74 | 14.55 | 9.28 | 3.79 | 7.79 |
| 1992 | 24.24 | 0.11 | 0.00 | 3.63 | 4.82 | 1.80 | 5.93 | 12.39 | 14.12 | 6.21 | 4.43 |
| CARS | SHIPS | PREC | FOOD | TEXT | LEATHER | CLOTH | WOOD | PAPER | PLAST | OTHER | |
| 1981 | 14.77 | 6.96 | 0.75 | 4.30 | 9.65 | 3.74 | 7.81 | 3.21 | 3.35 | 3.88 | 4.57 |
| 1982 | 4.32 | 7.97 | 0.86 | 4.48 | 8.99 | 3.31 | 6.37 | 3.57 | 2.03 | 4.26 | 5.21 |
| 1983 | 9.72 | 56.68 | 5.39 | 11.13 | 5.48 | 5.21 | 5.86 | 4.90 | 6.29 | 9.55 | 8.65 |
| 1984 | 13.15 | 155.45 | 1.63 | 10.34 | 8.81 | 3.43 | 7.34 | 3.13 | 2.51 | 2.84 | 5.96 |
| 1985 | 30.72 | 116.07 | 3.15 | 7.49 | 6.91 | 1.64 | 9.18 | 3.77 | 2.59 | 3.01 | 4.03 |
| 1986 | 15.09 | 51.23 | 2.38 | 1.11 | 5.70 | 2.37 | 19.63 | 2.54 | 2.61 | 5.63 | 2.93 |
| 1987 | 2.43 | 52.22 | 1.91 | 1.96 | 1.96 | 2.79 | 9.90 | 1.20 | 1.47 | 2.19 | 1.95 |
| 1988 | 16.23 | 48.65 | 1.09 | 1.34 | 3.07 | 5.03 | 7.11 | 0.71 | 0.84 | 0.79 | 0.65 |
| 1989 | 6.38 | 26.42 | 1.77 | 1.85 | 1.91 | 1.50 | 3.70 | 0.66 | 1.44 | 0.84 | 0.81 |
| 1990 | 58.32 | 21.05 | 0.64 | 1.69 | 4.97 | 1.41 | 2.34 | 0.79 | 3.32 | 5.71 | 0.71 |
| 1991 | 16.46 | 28.97 | 2.10 | 1.13 | 3.87 | 2.04 | 3.32 | 0.88 | 2.55 | 9.71 | 2.97 |
| 1992 | 32.53 | 38.22 | 1.76 | 0.92 | 3.65 | 3.56 | 2.58 | 1.14 | 3.66 | 10.11 | 1.44 |
FEDEA - D.T. 95-01 by C.García-Serrano, J. F. Jimeno, L. Toharia Table 14. Incidence of the reduction of working hours by manufacturing subsectors (Spain. 1981-1992).
| COAL | OIL | ELEC | MINE | META | NO.MET | CHEM | P.MET | EQUIP | M.ELEC | TRONIC | |
| 1981 | 0.00 | 0.00 | 0.02 | 0.15 | 2.92 | 0.98 | 7.00 | 34.06 | 7.41 | 10.30 | 0.08 |
| 1982 | 0.00 | 0.00 | 0.01 | 2.55 | 5.79 | 0.62 | 2.47 | 19.79 | 11.33 | 15.80 | 4.14 |
| 1983 | 0.00 | 0.00 | 0.01 | 0.12 | 7.71 | 0.51 | 1.36 | 22.39 | 13.77 | 19.06 | 3.35 |
| 1984 | 0.00 | 0.00 | 0.09 | 0.01 | 9.86 | 0.21 | 0.85 | 22.19 | 19.31 | 19.56 | 3.80 |
| 1985 | 0.00 | 0.01 | 0.17 | 0.10 | 7.93 | 0.35 | 0.31 | 11.54 | 13.53 | 25.27 | 0.34 |
| 1986 | 0.00 | 0.00 | 0.00 | 0.01 | 5.78 | 0.39 | 0.12 | 4.64 | 12.30 | 7.53 | 0.02 |
| 1987 | 0.00 | 0.00 | 0.01 | 0.62 | 0.40 | 0.42 | 0.11 | 3.77 | 4.08 | 16.29 | 0.22 |
| 1988 | 0.93 | 0.00 | 0.00 | 2.58 | 0.69 | 0.10 | 0.00 | 0.80 | 0.76 | 9.10 | 0.11 |
| 1989 | 0.00 | 0.00 | 0.00 | 0.00 | 4.18 | 0.01 | 0.02 | 0.72 | 3.40 | 9.64 | 0.17 |
| 1990 | 0.00 | 0.00 | 0.00 | 0.02 | 4.53 | 0.02 | 0.21 | 1.44 | 0.54 | 0.72 | 1.80 |
| 1991 | 0.00 | 0.00 | 0.00 | 0.00 | 4.52 | 0.23 | 0.30 | 2.45 | 2.01 | 1.16 | 0.09 |
| 1992 | 0.01 | 0.00 | 0.00 | 0.02 | 0.51 | 0.20 | 0.53 | 1.73 | 0.52 | 1.74 | 1.72 |
| CARS | SHIPS | PREC | FOOD | TEXT | LEATHER | CLOTH | WOOD | PAPER | PLAST | OTHER | |
| 1981 | 5.23 | 0.15 | 3.18 | 0.51 | 9.79 | 6.09 | 1.69 | 2.49 | 1.14 | 4.16 | 2.13 |
| 1982 | 22.69 | 1.49 | 1.35 | 0.36 | 4.81 | 2.10 | 1.89 | 1.13 | 1.50 | 3.26 | 3.92 |
| 1983 | 33.35 | 12.88 | 14.14 | 0.13 | 3.28 | 0.62 | 0.96 | 1.32 | 1.06 | 3.40 | 3.18 |
| 1984 | 43.49 | 23.96 | 6.09 | 0.19 | 6.62 | 2.15 | 1.88 | 1.82 | 2.22 | 5.03 | 2.48 |
| 1985 | 36.11 | 19.89 | 2.03 | 0.33 | 4.10 | 1.60 | 1.36 | 1.56 | 1.05 | 1.89 | 5.08 |
| 1986 | 21.19 | 19.38 | 4.56 | 0.18 | 0.62 | 0.53 | 0.70 | 0.34 | 0.17 | 0.79 | 1.37 |
| 1987 | 3.49 | 6.78 | 2.01 | 0.19 | 0.83 | 0.16 | 0.33 | 0.13 | 0.14 | 0.65 | 0.48 |
| 1988 | 4.42 | 3.60 | 0.19 | 0.09 | 5.74 | 1.06 | 0.36 | 0.10 | 0.07 | 0.08 | 0.07 |
| 1989 | 0.66 | 0.28 | 0.11 | 0.02 | 1.48 | 0.20 | 0.25 | 0.12 | 0.12 | 0.07 | 0.20 |
| 1990 | 8.18 | 0.00 | 0.95 | 0.10 | 1.58 | 0.11 | 0.31 | 0.15 | 0.06 | 0.20 | 0.25 |
| 1991 | 10.35 | 0.00 | 2.25 | 0.29 | 1.09 | 0.97 | 0.35 | 0.09 | 0.03 | 0.56 | 0.42 |
| 1992 | 6.13 | 0.05 | 0.01 | 0.28 | 0.78 | 0.43 | 0.17 | 0.24 | 0.08 | 0.22 | 0.80 |
Table 15. Average days of temporary layoff and average hours of reduction (Spain, 1982-1994).
| DAYS (TOTAL) | DAYS PER WORKER | HOURS (TOTAL) | HOURS PER WORKER | |
| 1982 | 26630357 | 118 | 59518887 | 397 |
| 1983 | 33825951 | 93 | 66023061 | 369 |
| 1984 | 34083907 | 86 | 78203061 | 358 |
| 1985 | 29220472 | 85 | 51050715 | 327 |
| 1986 | 27017725 | 104 | 43788875 | 500 |
| 1987 | 23686045 | 103 | 23619322 | 495 |
| 1988 | 23062778 | 108 | 13434444 | 385 |
| 1989 | 17789578 | 122 | 11448025 | 496 |
| 1990 | 23149295 | 90 | 13696826 | 475 |
| 1991 | 22687212 | 106 | 18009319 | 480 |
| 1992 | 22588446 | 97 | 11177719 | 455 |
| 1993 | 36008463 | 92 | 15608731 | 330 |
Figure 1. Number of EREs, by types.
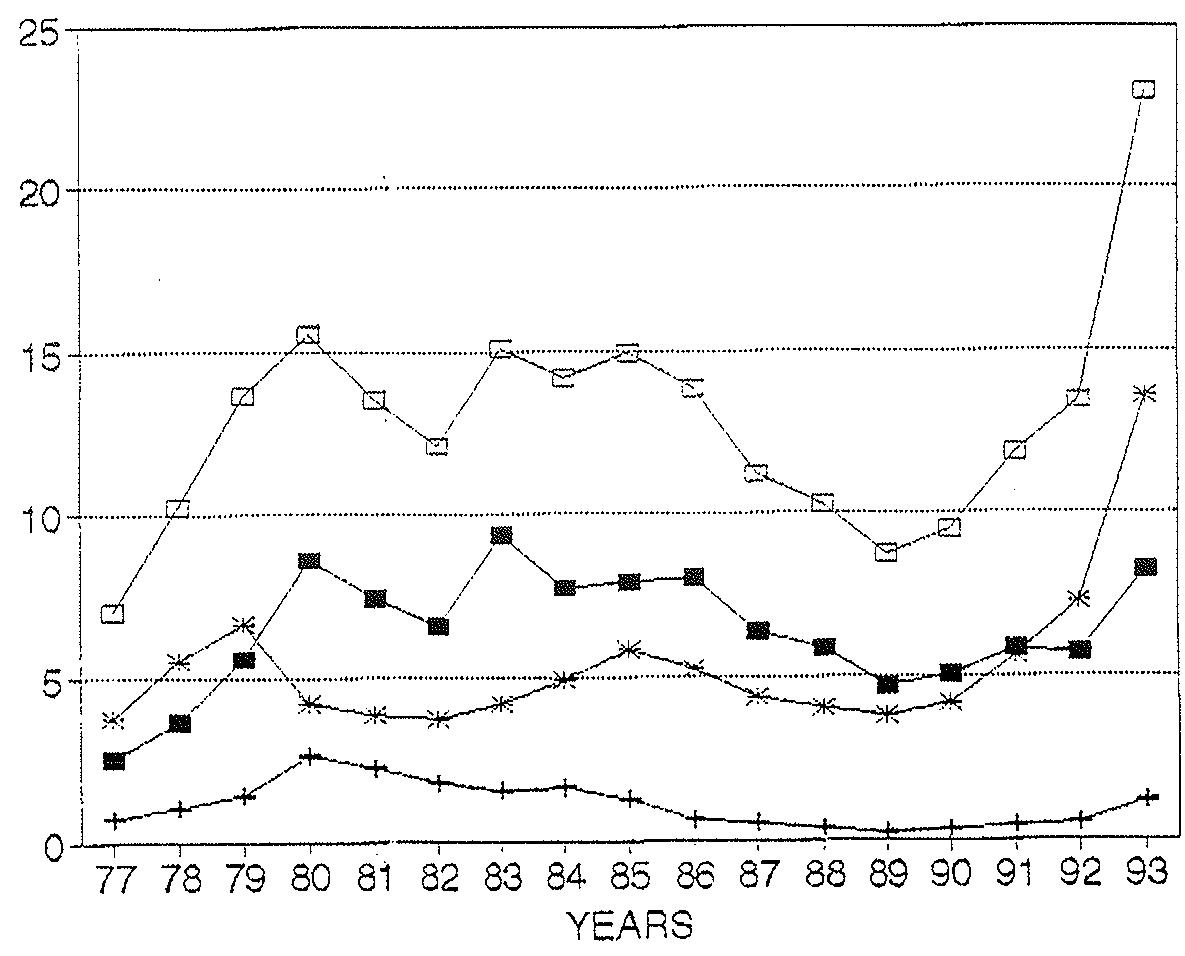
Figure 2. Employees affected by EREs, by types.
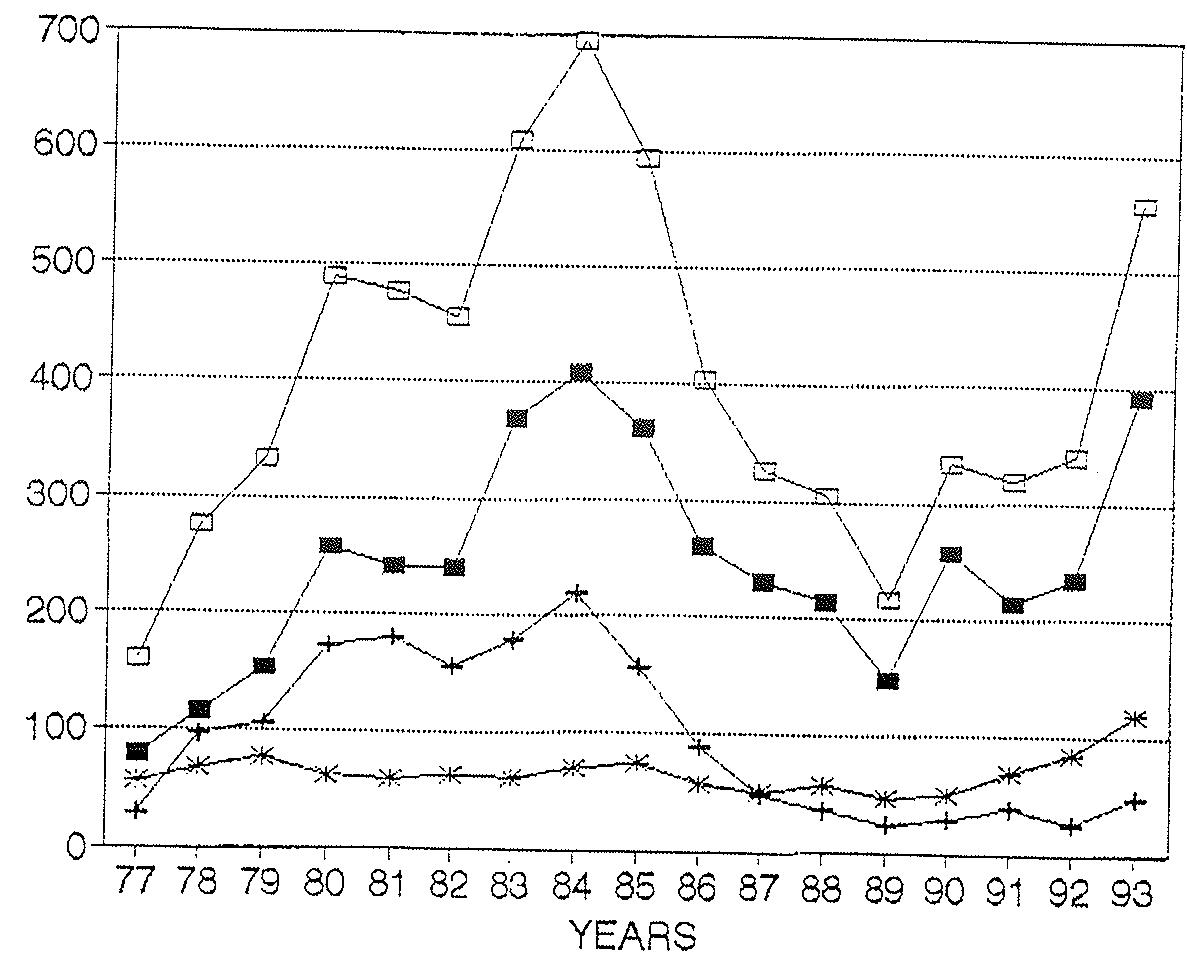
Figure 3. Incidence of EREs, by types.
ENTIDAD:
Departamento:
Persona de contacto:
Dirección:
Código Postal: Población: Capital:
Fax:
Deseo recibir regularmente:
[ ] Documentos de trabajo
[ ] Boletín
Deseo recibir el Documento de Trabajo N°......
Deseo recibir en diskette* el D.T. N°....
Remitir esta solitud a:
FEDEA - Documentación
Jorge Juan, 46
28001 MADRID
Fax: (91) 577 95 75
Telf. (91) 435 90 20
* Indicar el documento de trabajo deseado (a partir del n° 94-05). Se enviará un diskette que contenga el texto de dicho documento en formato WPD (Word Perfect versión 6.0), para su reproducción en tamaño DIN A4.
- 94-01: "HERMINS3. A three-sector structural model of the Spanish economy for the analysis of Community Support Frameworks", José A. Herce y Simón Sosvilla-Rivero.
- 94-02: "El mercado de depósitos a la vista en España: Bancos vs cajas de aborro", Juan Coello.
- 94-03: "An econometric Analysis of Foreign Direct investment in Spain, 1964-89", Oscar Bajo-Rubio y Simón Sosvilla-Rivero.
- 94-04: "The management of redundancies in Spain: An Economic report", Juan F. Jimeno y Luis Toharia.
- 94-05: "Modelling international capital movements in the Spanish economy: A portfolio-balance approach", Oscar Bajo-Rubio y Simón Sosvilla-Rivero.
- 94-06: "Demanda de tráfico telefónico nacional en España 1985-1989: Un estudio econométrico con datos de panel provinciales", Teresa Garín.
- 94-07: "Demanda de tráfico telefónico internacional en España 1985-1989: Un estudio econométrico con datos de panel provinciales", Teresa Garín.
- 94-08: "HERMIN-S4. A four-sector structural model of the Spanish economy for the analysis of Community Support Frameworks", Simón Sosvilla-Rivero y José A. Herce.
- 94-09: "European railway comparisons and the future of RENFE", John Preston y Chris Nash.
- 94-10: "The Effects of the Community Support Framework 1994-99 on the Spanish Economy: An analysis based on the HERMIN Model", José A. Herce y Simón Sosvilla-Rivero.
- 94-11: "A cost-benefit analysis framework for Spanish railway services", John Dodgson y Marta González Savignat.
- 94-12: "El mercado de trabajo en Andalucía: Los factores determinantes del paro masivo y persistente", Sonsoles Castillo, Rosa Duce y Juan F. Jimeno.
- 94-13: "Efectos del Marco de Apoyo Comunitario 1989-93 sobre el crecimiento y la distribución de la renta regional", Indalecio Corugedo, Lorenzo Dávila, Ricardo Martín y Pablo Moliner (en proceso).
- 94-14: "Desregulación y privatización del transporte público urbano en España", Ginés de Rus y Gustavo Nombela.
- 94-15: "Profitability of the different services of RENFE", John Dodgson y Pablo Rodríguez.
- 94-16: "Exchange rate volatility in the EMS before and after the fall", Simón Sosvilla-Rivero, Fernando Fernández-Rodríguez, Oscar Bajo-Rubio y Juan Martín-González.
- 94-17: "Consecuencias socio-económicas de las tendencias demográficas españolas". José A. Herce.
- 94-18: "Efectos de la desregulación del transporte aérero en España". Ofelia Betancor y J. D. Jorge Calderón.
- 94-19: "Regulación de las oficinas de Farmacia: Precios y libertad de entrada", Walter García-Fontes y Massimo Motta.
- 94-20: "Irreversibility, uncertainty and underemployment equilibria", David de la Croix y Omar Licandro.
- 95-01: " Workforce adjustment in Spain: Are working hours a choice variable?", Carlos García-Serrano, Juan F. Jimeno y Luis Toharia.
Este texto se ha extraído automáticamente del documento original. Para citarlo o leerlo con su maquetación, descargue el PDF.
Descargar en PDF