Environmental consequences of the Community Support Framework 1994-1999: Energy consumption and associated CO₂ emissions in Spain A HERMIN-model based evaluation by Vicente Antón*, Andrés de Bustos * José A. Herce **, Simón Sosvilla-Rivero ** DOCUMENTO DE TRABAJO 96-06
February, 1996
* General Directorate for Budgetary Planning, Ministry of Economy and Finance ** Foundation for Applied Economics Studies (FEDEA) and Universidad Complutense of Madrid
The authors acknowledge the financial support from the Directorate General XII of the European Commission under contract number JOU2-CT92-0257 of the JOULE II Programe. The views here expressed are those of the authors and do not necessarily concern their institutions.
Abstract
In this paper we consider the energy and environmental implications of the extra GDP growth that the CSF for the period 1994-1999 is capable of entail. In doing so, we have developed an illustration of the so-called three E's approach: economy-energy-environment. The extra growth induced by the CSF package and its incremental effects on energy consumption and emissions have been evaluated against an energy-economy baseline provided by the HERMIN-Spain model and the Spanish energy plan (PEN).
The most salient aspect of the analysis performed is that the energy saving and emissions cutting margins embodied in the so-called PEN scenario (due to energy substitution and energy efficiency) are rapidly exhausted when growth accelerates, for example due to a CSF like shock. However, these margins also reveal the promising prospects of pro-growth strategies with high energy efficiency content.
Keywords: Macroeconometric model, input-output analysis, environment. JEL codes: C53, C67, Q40
Contents
1. Introduction
2. Energy modelling 2.1 The Spanish Energy Input/Output Table 2.2 Energy consumption by sector and product 2.3 Emission factors by energy products 2.4 A simple matrix formulation 3. The macroeconomic impact of the CSF 1994-1999 3.1 The HERMIN-Spain Model 3.2 The Spanish CSF 1994-1999 3.3 Growth effects of CSF 4. The environmental consequences of CSF 1994-1999 4.1 An energy-economy baseline 4.2 Energy consumption and CO₂ emissions after the CSF 5. Concluding remarks
References
1. Introduction
The increased concern for economic and social homogeneity in the European Union (EU) (i.e., cohesion, in the language of EU policy marking) resulted in a reformulation and expansion of the existing variety of policies aimed at structural an growth objectives under the title Community Support Framework (CSF). From the start of the CSF process the clear aim was to provide the poorer peripheral members with a window of opportunity to rectify economic problems that were associated with their low level of income per capita, low level of productivity, high unemployment or underemployment and binding public sector and international payments constraints. In this economic context the CSF funding was targeted at boosting output growth and productivity in order to ease the transition of the poorer peripheral member states to a post-1992, post-EMU community.
In this paper, we consider the energy and environmental implications of the extra GDP growth that the CSF for the period 1994-1999 is capable of entail. This is a way to achieve two different goals. First, we extend the use of the HERMIN-Spain model to an application not developed so far. Second, we ascertain the limits of the energy scenarios included in the Spanish Enery Plan for the period 1990-2000. As a third result, we combine macroeconometric analysis with energy Input-Output (I-O) techniques and technical knowledge concerning emissions hoping this approach will help to integrate economic and energy/environment analyses. Section 2 deals with the way energy and emissions are integrated with the different economic activities through the energy consumption coefficients (per unit of output) and the emission factors (per unit of energy input). Section 3 briefly describes the HERMIN-Spain model, the Spanish CSF for the period 1994-1999, and establishes the macroeconomic impact of this EU programme. Section 4 describes the energy scenario set up by the Spanish Energy Plan and shows the computations relative to the energy consumption and emissions, under the energy scenario parameters, that will likely accompany the realisation of the 1994-1999 CSF. A final section contains various concluding remarks.
2. Energy modelling
In this section we describe the kind of energy modelling exercise carried out in our evaluation of the environmental consequences of the CSF 1994-1999. It basically consists in obtaining accurate indicators of unit energy consumption factors, sufficiently disaggregated by energy product and economic activity in order to properly capture composition effects, and emission factors per unit of the same energy products. These are available for the Spanish economy, together with a medium term energy scenario that accounts for energy substitution and technology trends. The units in which energy requirements and emissions will be measured are, respectively, terajoules (i.e., joules) and metric tons of . Let us start by the descripcion of the Spanish energy data.
2.1 The Spanish Energy Input/Output Table
The Spanish I-O Table for Energy (TIOEN, from now on) was first published by the Spanish statistical office referred to the year 1980. The latest has been published in 1991 (see INE, 1991) and covers the year 1985. A third one is expected referred to the year 1990. The TIOEN-85 has the standard I-O table format in which, vertical technical coefficients (see Table 2.1) are the energy requirements, per unit of output, of all the sectors listed by columns. These requirements reffer to nine different energy sectors providing their corresponding composite product, of which, the refined oil sector has been further disaggregated to six other basic products. However, instead of valuing energy requirements at current prices, the TIOEN-85 values them in terajoules, so that a phisical homogeneous unit is used. This, provided that output of the different activity branches is expressed at constant prices, enables the technical coefficients to be interpreted as genuinely representing the energy technology the disaggregated economy is actually using. The sectoral disaggregation of the TIOEN-85 runs through the 56 branches of the standard Spanish I-O table.
We make use of the methodology developed by Antón et al. (1992) and Antón and de Bustos, (1995) to project the TIOEN-85 to the year 1992 taking into account the observed patterns of energy substitution by economic sector and changes in relative prices. Table 2.1 shows the energy requirements in 1992, by large economic sector, of the nine energy composite products considered. As previously mentioned, the coefficients are to be interpreted as terajoules per unit of output (billion pesetas at 1989 prices) and not, as it is the case in standard I-O tables, as nominal unit requirements of inputs.
| Table 2.1Energy technical coefficients by large sector and energy product 1992(in TeraJoules per billion pta at 1989 prices) | |||||
| Energy providing sector(energy products) | Agriculture, fishing and forestry | Manufacturing | Energy, mining, B&C and marketed services | Non marketed services | Total energy inputs per product |
| Coal and its agglomerates | 0.00 | 4.38 | 14.81 | 0.41 | 9.39 |
| Lignite and its agglomerates | 0.00 | 0.07 | 4.10 | 0.00 | 2.25 |
| Coke | 0.00 | 4.22 | 0.02 | 0.00 | 1.26 |
| Crude oil | 0.00 | 0.00 | 51.22 | 0.00 | 27.83 |
| Refined oil and derivatives | 26.40 | 17.83 | 24.93 | 10.68 | 21.39 |
| Natural gas | 0.00 | 5.36 | 2.15 | 1.63 | 2.93 |
| Electricity | 3.10 | 9.04 | 4.43 | 4.00 | 5.67 |
| Gas products | 0.00 | 0.85 | 0.35 | 0.16 | 0.46 |
| Nuclear fuels | 0.00 | 0.00 | 13.20 | 0.00 | 7.17 |
| Total energy inputs per sector | 29.50 | 41.75 | 115.21 | 16.87 | 78.34 |
| Source: INE (1991) and own computations | |||||
2.2 Energy consumption by sector and product
The HERMIN-Spain model, briefly described in section 3.1 below, considers four main economic sectors:
i) Agriculture, fishing and forestry (A sector)
ii) Manufacturing (T or tradeables sector)
iii) Mining, energy, building and construction (B&C) and marketed services (N or non-T sector)
iv) Non marketed services (G or -mostly- government sector)
It can be seen, in Table 2.1, that the N sector, due to its inclusion of the energy branches, has the highest energy requirements per unit of output. However, once corrected the N sector figure by own intermediate consumption in the energy sector, the manufacturing, or T sector, has higher unit energy requirements than the rest. We are nevertheless interested in total energy consumption, either directly used by the non energy economic sectors, by the energy generators themselves, or allocated to final demand. Thus, for instance, we see that the major energy user is the energy sector, or that fossil fuels amount to almost 84% of total intermediate demand of energy products.
However, as our aim is to analyse the emissions out of the effective use of energy, it is not enough to estimate global energy consumption. In general, me are interested in energy products actually used as fuels, that is, "burned". Thus me must take into account the nature of any energy product considered (for instance, the use of electricity does not entails emissions), its final use (as fuel, for chemistry or as an input for other energy products), and the consuming sector it is supplying (exports, for instance, do not entail domestic emissions)
2.3 Emission factors by energy products
The statistical office of the European Union, EUROSTAT, has established standard emission factors, in metric tons per terajoule, for for the energy products breakdown as shown in Table 2.2. Emissions of and other pollutants will differ not only across energy products, given the same use, for instance, burning coal or fuel for heating, but also, for a given energy product, across uses, for instance using fuel for transportation or for heating. The emission factors of Table 2.2 are to be taken as corresponding to a homogenised use. The conventional energy uses considered by EUROSTAT are heating, transportation, energy transformation, other non energy uses and other uses. Besides the carbon or contents of each energy product, the technology applied to every product-use couple, at a given time, accounts for the differences stated in Table 2.2.
| Table 2.2 $CO_2$ emission factor per energy products in Tons per TeraJoule (standardised use) | |
| Energy product | $CO_2$ Tons/TJ |
| Coal and its agglomerates | 94 |
| Lignite and its agglomerates | 106 |
| Coke | 108 |
| Crude oil | 0 |
| Refined oil and derivates: | -- |
| L.P.G. | 65 |
| Gasoline | 72 |
| Naftas | 78 |
| Fuels for transportation | 74 |
| Fuels for heating and other uses | 78 |
| Other refined oil products | 78 |
| Natural gas | 56 |
| Electricity | 0 |
| Gas products | 56 |
| Nuclear fuels | 0 |
| Source: EUROSTAT | |
However, the evolution of technology and the switch to less polluting energy sources, that go hand in hand very often, may produce dramatic reductions in aggregate emissions out of the economic activity. In Western societies, the abandoning of conventional manufacturing and the advancement of value added service activities do also produce similar results. This is why the figures in Table 2.2 have to be taken as a reference that will have to be correspondingly adjusted for longer term projections. In fact, the energy-economy baseline of this exercise, described in section 4.1, does this following the best experts' consensus available.
2.4 A simple matrix formulation
This section adapts the treatment offered in Antón and de Bustos (1995) in order to provide a compact matrix formulation of the integrated computation of energy requirements and emissions associated to a given change in the level of GDP, Value Added, Final Demand or any other aggregated activity indicator.
The input/output methodology requires that each activity branch fulfills the equality between resources (R) and uses (U). Resources account for domestic production (P) and imports (M) and uses are intermediate demand (ID), and final demand (FD). Final demand includes exports. Thus or . We can redefine FD to include imports so that:
\[P \equiv I D + F D\tag{1}\]
This identity is also fulfilled by the energy branches whose magnitudes are measured in physical units (terajoules).
Following the Leontief notation, total effective production supplies intermediate demand and final demand . P, ID and FD are column vectors made of as many elements as sectors we are considering in the economy (up to 56 in the Spanish I-O tables). We can also express ID as equal to the product of the technical coefficients matrix and P itself, so that we recover the well known Leontief expression for total production:
\[P = (I - A) ^ {- 1} F D\tag{2}\]
where the sectors have been rearranged as follows:
\[P = \left[ \begin{array}{l} P _ {1} \\ P _ {2} \end{array} \right]; \quad A = \left[ \begin{array}{l l} A _ {1 1} & A _ {1 2} \\ A _ {2 1} & A _ {2 2} \end{array} \right]; \quad F D = \left[ \begin{array}{l} F D _ {1} \\ F D _ {2} \end{array} \right]\tag{3}\]
with the subscripts 1 and 2 reffering, respectively to energy (nine sectors) and other (forty seven) activities. Note that the elements of and are measured in terajoules, the elements of and are values at current or constant prices, the elements of and are scalars, the elements of are measured in terajoules per unit value and, finally, the elements of are measured in values per terajoule. It can be shown [see the Annex in Antón and de Bustos (1995)] that the elements of keep the corresponding measurement units as in , so that the coherence of the computations is guaranteed despite the fact that vectors and matrices in (2) contain mixed elements.
For the analysis carried out here, we require the invariability of the energy technical coefficients, elements of and . In other terms, the computation of the energy demand generated by the productive process (intermediate demand), along a given time period, is immediate when a reference scenario of the different branches that make up the economy is available. This computations are then corrected to embody the forecasts of the Spanish energy plan (1990-2000), and afterwards, related to energy efficiency and energy substitution.
Partitioning (1) and considering energy alone, its total consumption is given by:
\[P _ {I} = I D _ {I} + F D _ {I}\tag{1'}\]
However, not any form of energy consumed implies emissions necessarily: certain energy products do never originate emissions depending on their use (production of natural gas, coal used for cocke, etc). Thus, in order to obtain emissions strictly associated to energy consumption, each branch of the intermediate demand matrix will need to be corrected in order to account for these non emitting uses or products. As for the final demand, exports, in particular, will have to be deducted.
Let us call the corrected vector of expressions (3) and (2). This correction rescales effective production to its actual emissions content. Total emissions can be thus obtained as:
\[C O _ {2} = E F \circ P _ {1} ^ {*}\tag{4}\]
where EF is the row vector of emissions factors per energy product assigned effectively to emitting activities.
3. The macroeconomic impact of the CSF 1994-1999
Once the energy modelling options for this exercise have been established, we turn on to its macroeconomic aspects focused on the growth consequences of the CSF for 1994-1999. This section thus starts with a short description of the macroeconometric model HERMIN-Spain, that we have used for simulating the CSF growth effects. We then describe the Spanish CSF for 1994-1999 and, finally, we show the results of the macroeconomic simulations. This is the starting point for the assessment of the environmental consequences of such an extra push to the Spanish economy. This section is based in Herce and Sosvilla-Rivero (1994, 1995).
3.1 The HERMIN-Spain Model
The HERMIN-Spain model has been conceived as a four sector model of the Spanish economy. The progressive sectoral breakdown for HERMIN-Spain is as indicated in the Table 3.1. The choice of the sectoral disaggregation is justified by the desire of keeping the model as small and simple as possible while separating sectors with different behaviour and driven by different forces:
i) the public sector (G) is dependent on government policy decisions, with expenditure and tax rates as instruments,
ii) the exposed tradable sector (T) is driven by both domestic and foreign demand, and by international cost competitiveness,
iii) the protected non-tradable sector (N) is driven by domestic demand, and
iv) the agricultural sector (A) is treated as mainly exogenous.
| Table 3.1Sectoral breakdown in HERMIN-Spain | ||
| 2 Sectors | 3 Sectors | 4 Sectors |
| S1 Government (G) | S1 Government (G) | S1 Government (G) |
| S2 Private (P) | S2.1 Private Non Ag.(NA) | S2.1.1 Tradable (T): Industry |
| S2.1.2 Non Tradable (N): Energy, Building and Construction and Private Marketed Services | ||
| S2.2 Agriculture (A) | S2.2 Agriculture (A) | |
In building the HERMIN-Spain model, we have opted for simple and encompassing theoretical foundations sufficiently established in other modelling exercises similar to this one. The way output, employment, wages, prices and aggregate demand are determined by the corresponding agents in the different sectors of the economy is explained summarily in Table 3.2.
Taking into account that the model is going to be used for long-run policy analysis, the behaviour of the agents we are considering is not going to be affected by cyclical factors. This allows us to simplify further the specifications by just considering the fundamental determinants of the agents' decisions in agreement with the underlying theories. The most typical behavioural equations used in HERMIN-Spain are also listed in Table 3.2. As it can be seen, output, factors demand, wages and output deflator equations are estimated for each of the sectors considered although those for the government and agricultural sectors have been modelled in a rather ad hoc fashion. Absorption deflators follow a common pattern dictated mostly by the GDP deflator, which is a linear combination of sectoral output deflators, import prices and indirect taxes. Labour supply is disaggregated by sex and depends on unemployment and other factors while aggregate demand components depend on different determinants like disposable income, world demand, competitiveness, etc.
An important feature of the HERMIN-Spain model is that it is able to compute "supply effects" or externalities due to certain shocks the economy may suffer like changes in infrastructure or human capital. This are precisely the kind of effects provoked by the CSF projects, besides the more conventional aggregate demand shocks. The adaptation of a macroeconometric model to deal with supply effects is also explained in Herce and Sosvilla-Rivero (1994) and Bradley, Herce and Modesto (1995).
3.2 The Spanish CSF 1994-1999
This section presents the total financial endowments of the Spanish CSF for the 1994-99 period distinguishing by functional sector of destination and institutional sector of origin. In this exercise we will be dealing with the amounts envisaged by the Spanish Regional Development Plan (RDP) submitted by the Ministry of Economic and Finance to the EU Commission within the CSF negotiating procedure and finally approved by Brussels [see Ministerio de Economía y Hacienda (1994)].
Spain is the major recipient of CSF grants of Community origin. However, not all its regions are eligible, under objective number 1 of the structural funds, for them. Out of the seventeen regions, plus the towns of Ceuta and Melilla in the North-African coast, only ten and the two beforementioned towns are elegible. The total Spanish CSF funds for the 1994-99 period amount to 48.9 bn ECU at 1994 prices of which, on average, the EU contribution will be 67.3%. In annualized terms, this is equivalent to almost 2% of the Spanish GDP for 1994 although some regions will have much larger figures. These regions are the less developed according to the Structural Funds criteria, basically GDP per head relative to the Union's average. These regions happen to have also higher unemployment ratios and lower infrastructural endowments.
CSF expenditures are directed towards three major areas: physical infrastructure, human resources and aids to production and firms. The CSF is, however, nothing but the "financial envelope" of a series of operational programmes grouped under the umbrella of the RDP. The RDP is thus the operational pillar of the EU's regional policy while the CSF is its financial pillar or the counterpart of the RDP.
Every funded intervention of the CSF must be integrated within an operational programme. Typically, the CSF consists of several hundreds of such interventions, and their corresponding financial plans, ranging from transport infrastructure projects to funding for the provision of hospital equipment. These interventions are funded both by the EU and by the recipient member State and, as for the last share, all public administrations as well as public and private firms may intervene.
Within the three major categories of expenditure first mentioned, there exists also a detailed breakdown according to the sector to which they are directed. Table 3.3 shows the sector/subsector details and the origing of funds, as well as the relevant total amounts. One thing to be noticed is that private expenditure makes part of the total CSF funds on top of EU and national public funds. This private expenditure is assumed by the CSF authorities to accompany public aids to production, very often as a requirement for the last to be agreed to firms. As for the total CSF public funds, expenditure on physical infrastructure represents 46.7% of the total, expenditure on human resources 21.4% and production aids 31.3%.
| Table 3.3Spanish CSF 1994-99 Funds Distribution by Sector (bn. ECU 1994) | ||||||||
| CSF sector/subsector code | EU funds | EU funds % of (1) | Gov. funds | Gov. funds % of (1) | Total public funds (1) | Private invest. | Private invest. % of (2) | Total CSF funds (2) |
| 1. Physical infrastructure | 11250.4 | 61.6 | 7001.8 | 38.4 | 18252.1 | 0.0 | 0.0 | 18252.1 |
| Transport | 6099.7 | 64.6 | 3339.0 | 35.4 | 9438.6 | 0.0 | 0.0 | 9438.6 |
| Energy | 623.8 | 40.0 | 935.7 | 60.0 | 1559.4 | 0.0 | 0.0 | 1559.4 |
| Communications | 417.9 | 35.0 | 776.2 | 65.0 | 1194.1 | 0.0 | 0.0 | 1194.1 |
| Environment | 3034.0 | 68.3 | 1406.4 | 31.7 | 4440.4 | 0.0 | 0.0 | 4440.4 |
| Health equipments | 452.3 | 60.7 | 292.6 | 39.3 | 744.8 | 0.0 | 0.0 | 744.8 |
| Education equipments | 622.8 | 71.2 | 252.0 | 28.8 | 874.8 | 0.0 | 0.0 | 874.8 |
| 2. Human Resources | 6276.8 | 75.1 | 2084.0 | 24.9 | 8360.9 | 29.3 | 0.3 | 8390.1 |
| Specific training needs for industry | 126.3 | 75.0 | 42.1 | 25.0 | 168.4 | 0.0 | 0.0 | 168.4 |
| Specific training needs for tourism | 11.8 | 75.0 | 3.9 | 25.0 | 15.8 | 29.3 | 65.0 | 45.0 |
| Specific Training for R&D | 164.5 | 75.4 | 53.7 | 24.6 | 218.2 | 0.0 | 0.0 | 218.2 |
| Occupational training | 1602.3 | 74.6 | 546.7 | 25.4 | 2149.0 | 0.0 | 0.0 | 2149.0 |
| Permanent training | 460.5 | 75.3 | 151.2 | 24.7 | 611.7 | 0.0 | 0.0 | 611.7 |
| Employment promotion | 3322.3 | 75.4 | 1085.4 | 24.6 | 4407.7 | 0.0 | 0.0 | 4407.7 |
| Specific measures for long-term unemp. | 589.2 | 74.6 | 201.1 | 25.4 | 790.3 | 0.0 | 0.0 | 790.3 |
| 3. Production aids | 8584.5 | 70.4 | 3605.1 | 29.6 | 12189.7 | 9824.2 | 44.6 | 22013.8 |
| To A sector | 3234.0 | 72.1 | 1252.5 | 27.9 | 4486.5 | 961.8 | 17.7 | 5448.2 |
| To T sector | 2467.1 | 70.5 | 1034.2 | 29.5 | 3501.2 | 3834.8 | 52.3 | 7336.0 |
| To N sector | 2883.5 | 68.6 | 1318.5 | 31.4 | 4202.0 | 5027.7 | 54.5 | 9229.6 |
| 4. Miscellaneous | 188.3 | 75.7 | 60.4 | 24.3 | 248.7 | 0.0 | 0.0 | 248.7 |
| Total | 26300.0 | 67.3 | 12751.3 | 32.7 | 39051.3 | 9853.4 | 20.1 | 48904.7 |
| Source: Spanish Ministry of Finance. One ECU in 1994 amounts to 155 Pta. | ||||||||
The shock to the regional economies is substantial, as said before, annualized CSF expenditure amounts to almost 2% of GDP for the whole country, while the corresponding regional figures are much higher on average doubling that figure for the ten objective number one regions.
3.3 Growth effects of CSF
HERMIN-Spain computes the standard macroeconomic consequences of demand shocks on GDP, prices, empleoymment, etc. But CSF is not only a demand shock, it is, above all, a supply shock and our model is able to treat this by considering different externalities enabled by the sectoral dimension and the type of CSF intervention. We have assumed that CSF expenditure on public infrastructure, training and aids to production may have two major effects on the private sectors of the economy: and increase in the productivity with which private factors are used (these expenditures enter the private production functions as unpaid factors), and an increase in the attractiveness to world demand of the domestic production as a result of increased differentiation, lower costs, etc. [for a comprehensive discussion of externalities in the HERMIN-Spain model see Herce and Sosvilla-Rivero (1994)]. We present here the results of the total CSF expenditure on a series of macroeconomic indicators. In order to quantify the role of the externality mechanisms on growth, Figure 3.1 presents the results of two simulations showing the impact of CSF expenditure on real GDP: one shows the Keynesian (demand) effects of the total CSF on real GDP (excluding any positive externalities), and the other adds, to the previous one, the supply effects induced by externalities like the increased productivity of private factors due to the operation of larger and better infrastructures, the availability of more human capital, better presence in international markets, etc.
Figure 3.1. CSF 1994-99: Total impact on GDP at factor cost.
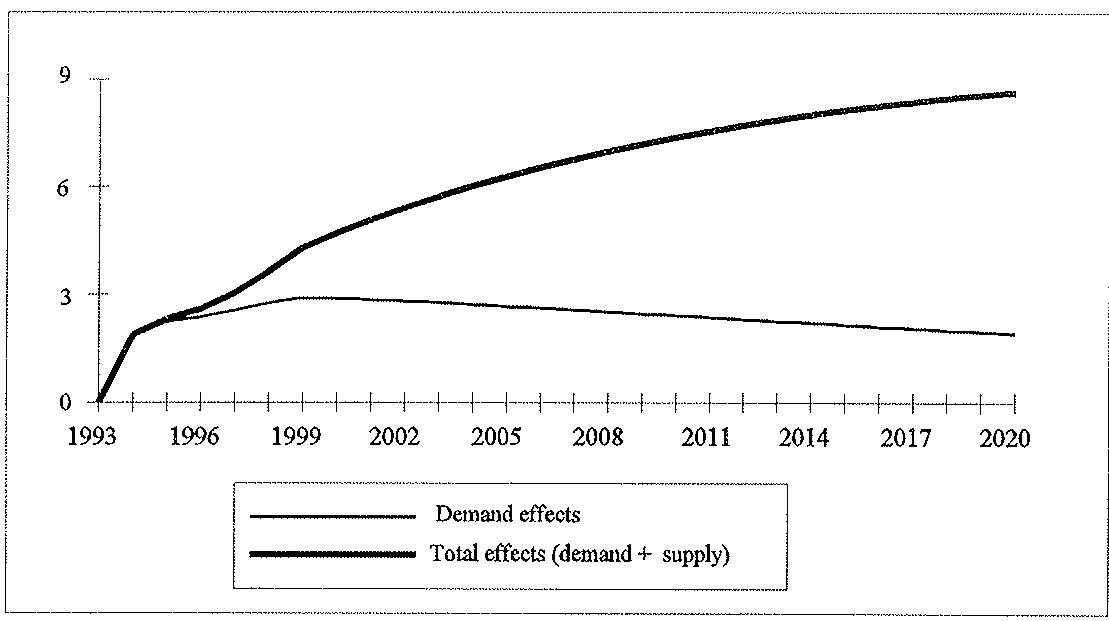
Percentage change over baseline.
The demand impacts increase real GDP by 1.90% over the non-CSF baseline in 1994, rising gradually to 2.92% in 1999, and then steadily declining to 1.93% by the year 2020. The full impacts (demand plus supply) are initially the same in 1994, but have risen to 4.30% by 1999, reaching 8.65% in the year 2020. Table 3.4 summarises the CSF effects on some key macroeconomic variables in addition to GDP (at factor cost). Note that the total public finance shock (EU grant plus public domestic) constitutes 1.55% of GDP in the initial year, gradually increasing to 2.03% by 1999, and then slowly declining to 1.21% by the year 2020. It has been assumed that CSF will continue beyond 1999 in roughly the same terms.
| Table 3.4CSF 1994-99: Total Effects | |||||||||
| 1994 | 1996 | 1999 | 2010 | 2020 | |||||
| Demand effects | Demand effects | Total effects | Demand effects | Total effects | Demand effects | Total effects | Demand effects | Total effects | |
| Shock* | 1.55 | 1.73 | 1.73 | 2.03 | 2.03 | 1.56 | 1.56 | 1.21 | 1.21 |
| GDP** | 1.90 | 1.73 | 2.60 | 2.92 | 4.30 | 2.42 | 7.38 | 1.93 | 8.65 |
| Inflation** | 1.93 | 2.39 | 2.74 | 2.96 | 4.81 | 2.62 | 6.81 | 2.34 | 7.00 |
| Employment** | 1.71 | 2.14 | 1.89 | 2.64 | 1.78 | 2.22 | 2.68 | 1.78 | 3.32 |
| Gov. Deficit* | 0.29 | -0.23 | -0.18 | -0.26 | -0.27 | -0.16 | -1.15 | -0.09 | -1.71 |
| Trade Bal.* | -1.19 | -1.31 | -1.29 | -1.44 | -1.32 | -0.91 | -0.67 | -0.62 | -0.47 |
| * Differences with respect to baseline** Percentual differences with respect to baseline | |||||||||
The increase of GDP over its estimated baseline is thus to be attributed to the realisation and operation of the CSF projects. This extra GDP is supplied by the different sectors of the economy, using intermediate inputs and energy, and entails private consumption activities also related with energy use.
4. The environmental consequences of CSF 1994-1999
Having established the order of magnitude in which GDP and other relevant macroeconomic indicators will evolve after the CSF, we turn to the proper energy baseline upon which extra energy and emissions, due to the CSF programme, must be assessed. By energy baseline we mean the consolidation in the long run of the observed past trends concerning energy substitution and energy saving. Of course, more growth will, other things been equal, mean more energy consumption and thus more emissions. But this will not necessarily happen should the trend towards less energy consumption and the use of less polluting energy products continues at the observed rate of change.
4.1 An energy-economy baseline
The baseline for the energy scenario in the near future is that of the Spanish energy plan, the Plan Energético Nacional (PEN), for 1990-2000. Out of this, the actually more important items are those relating energy saving and energy substitution. The details by product and consuming sector can be seen in Table 4.1.
| Table 4.1Final energy demand with and without energy substitution and energy saving(in 1000 tons of oil equivalent, Ktoe) | ||||||
| Base1990 | “No change” scenario2000 | Energy substitution(a) | Energy saving(b) | PEN scenario2000 | PEN vs. “No change” (in %) | |
| By energy product | ||||||
| Coal | 4,271 | 4,687 | -551 | -453 | 3,683 | -21.4 |
| Oil products | 40,762 | 56,221 | -1,658 | -4,303 | 50,260 | -10.6 |
| Natural Gas | 4,531 | 6,069 | +1,750 | -583 | 7,236 | 19.2 |
| Electricity | 10,975 | 16,421 | -121 | -660 | 15,640 | -4.8 |
| By consuming sector | ||||||
| Industry | 24,408 | 32,104 | -447 | -2,048 | 29,609 | -7.8 |
| Transportation (c) | 22,639 | 32,696 | 0 | -3,136 | 29,560 | -9.6 |
| Rest | 13,492 | 18,598 | -133 | -815 | 17,650 | -5.1 |
| TOTAL | 60,539 | 83,398 | -580 | -5,999 | 76,819 | -7.9 |
| (a) Decrease (-) or increase (+) in the use of the corresponding type of energy by all sectors or all types of energy by the corresponding sector, in the period 1990-2000, due to energy substitution.(b) Savings in the use of the corresponding type of energy by all sectors or all types of energy by the corresponding sector, in the period 1990-2000, due to improved energy efficiency.(c) Includes the use of private vehicles.Source: Plan Energético Nacional (PEN) | ||||||
In a no-change scenario, with neither energy substitution nor energy efficiency, energy demand would grow, in the 1990-2000 period, by 37.8% (i.e., a per year cumulative rate of 3.3%). However, as the energy substitution and energy saving trends continue, demand growth will happen at a lower rate than economic activity. Thus, the scenario of the Spanish energy plan foresees an increase in energy demand of 26.9%, almost 10 percentage points below the no-change figure mentioned before.
Energy substitution would only deliver a very minor part of these savings, taking place mostly in the manufacturing sector and through the displacement of coal and oil in favour of natural gas. More than 90% of the energy savings would come from the greater efficiency with which it is used after technological improvements and equipments renewal. These results will be obtained basically through a more efficient oil combustion and should occur in the transportation and industry sectors. At the end of the period, energy demand should be an almost 8% lower than in the no-change scenario, 76.8 ktoe against 83.4 ktoe, in 2000, out of 60.5 ktoe in 1990.
In order to adapt the PEN scenario to this exercise, for the period up to 2000, we have kept the energy consumption per unit of output that can be computed from the hypothesis of the PEN. This ratio has then been applied to both the baseline output and the output growth attributed to the CSF. The Spanish energy plan however, goes not beyond the year 2000 and thus we have extrapolated the PEN scenario up to 2020 based on its good fulfilment record to date and expert's views on the likely future of trends related to energy efficiency and energy substitution, basically a continuation of past trends.
Finally, the PEN and afterwards scenario have been rescaled to the HERMIN-Spain macroeconomic baseline so to establish our energy-economy baseline for this exercise. It is contained in Table 4.2, where the trends in GDP, energy use and emissions are those discussed in the previous sections. The growth in energy use and emissions is regularly kept below that of GDP due to a combination of energy efficiency and energy substitution measures foreseen by the Spanish Energy Plan.
This implies that energy use and emissions factors per unit of GDP are diminishing across time at rates of, respectively, 0.5% and 0.7% per year. In other words, energy use per unit of output is almost 12% lower in 2020 than in 1994 being 16.5% the corresponding figure for emissions.
| Table 4.2An energy - economy baseline | |||||
| 1994 | 1996 | 1999 | 2010 | 2020 | |
| GDP (in volume) | 100.0 | 102.4 | 107.0 | 127.8 | 153.0 |
| Energy use | 100.0 | 100.1 | 101.2 | 116.4 | 135.3 |
| Intermediate demand | 100.0 | 100.1 | 101.0 | 115.3 | 133.7 |
| Private consumption | 100.0 | 100.4 | 103.3 | 125.5 | 149.1 |
| En. use per unit of GDP | 100.0 | 97.8 | 94.6 | 91.0 | 88.4 |
| CO2 emissions | 100.0 | 99.4 | 99.7 | 109.6 | 127.8 |
| CO2 em. per unit of energy | 100.0 | 99.3 | 98.5 | 94.2 | 94.5 |
| CO2 em. per unit of GDP | 100.0 | 97.1 | 93.2 | 85.6 | 83.5 |
| Source: Plan Energético Nacional and own computations. | |||||
| by private consumption* | 1.8 | 2.6 | 4.5 | 7.2 | 8.2 |
| * Percentual differences with respect to baseline | |||||
This margin, however, is not enough for accommodating economic growth at a reasonable rate, say 2.5% per year, without increasing the absolute emissions level. In fact, GDP growth, as shown in Table 4.2, should be about half its value in order to keep the 1994 emissions level. It has been regularly argued that energy efficiency and energy substitution measures should be intensified in order to cope with more and more strict environmental regulations. We can actually conclude that, under moderately positive energy scenarios of the kind of the one discussed here, energy use and, above all, emissions will continue to grow. This is particularly true when GDP growth accelerates due to positive shocks like those induced by the CSF that we analyse in the next sub-section.
4.2 Energy consumption and emissions after the CSF
Table 4.3 contains the computations referred to the long-run energy and environmental consequences of the CSF. The figures are percentual differences with respect to the corresponding baseline levels (see Table 4.2) due to the realisation of the CSF shock from 1994 on. The figures for GDP are those in Table 3.4. It is apparent that energy use and emissions increase roughly pari pasu with the increase in GDP after the CSF shock. This seems to contradict the energy and emissions per unit of GDP figures given in Table 4.2 for the baseline in that a lower impact should be expected given the energy efficiency and energy substitution properties of the economy.
| Table 4.3Energy consumption and CO2 emissions after the CSF | |||||
| 1994 | 1996 | 1999 | 2010 | 2020 | |
| GDP* | 1.9 | 2.6 | 4.3 | 7.4 | 8.7 |
| Value Added* | 1.7 | 2.4 | 4.2 | 7.7 | 9.1 |
| Energy use* | 2.4 | 3.2 | 5.0 | 7.7 | 8.8 |
| by private consumption* | 1.8 | 2.6 | 4.5 | 7.2 | 8.2 |
| by intermediate demand* | 2.4 | 3.2 | 5.0 | 7.8 | 8.9 |
| by the T sector* | 0.3 | 1.2 | 3.8 | 11.2 | 13.4 |
| by the N sector* | 3.0 | 3.8 | 5.6 | 7.2 | 7.7 |
| CO2 emissions* | 2.0 | 2.8 | 4.6 | 8.0 | 9.4 |
| by private consumption* | 1.8 | 2.6 | 4.5 | 7.2 | 8.2 |
| by intermediate demand* | 2.1 | 2.8 | 4.7 | 8.2 | 9.7 |
| by the T sector* | 0.3 | 1.2 | 3.8 | 11.2 | 13.4 |
| by the N sector* | 3.0 | 3.8 | 5.6 | 7.2 | 7.7 |
| * Percentual differences with respect to baseline | |||||
The explanation lies in the fact that in both figures different composition effects are actually showing up. The CSF shock promotes extra growth, with a different composition than total value added for the economy, in such a way that the energy and emissions balance of this extra growth is slightly worst that the average balance. In particular, the manufacturing sector results specially favoured by the CSF shock being this sector more energy and emissions intensive than the rest.
Comparing the energy use and emissions resulting from the CSF induced economic growth with the margin created by energy saving and energy substitution (see Table 4.2), we can see that this margin continues to exist after the CSF shock, despite the fact that both energy and emissions have increased above the baseline. This by no means is intended to justify economic growth because of its moderate environmental effects, on the contrary this comment aims at illustrating the likely success of pro growth strategies that have also a substantive energy and environmental content. In this respect, many CSF projects have this potential and they should be more closely evaluated.
5. Concluding comments
In the previous pages we have developed an illustration of the so-called three E's approach: economy-energy-environment. The links between these three areas have been the energy technical coefficients provided by the Spanish I-O energy table and the emission factors provided by EUROSTAT. Technical coefficients link economic activity with energy consumption, and emission factors link energy consumption with emissions. Moreover, we have used a macro-sectoral econometric model of the Spanish economy, HERMIN-Spain, to ascertain the economic consequences of the Community Support Frameworks directed towards the less developed Spanish regions.
The extra growth induced by this aids package means more energy consumption and more emissions. These incremental effects have been evaluated against an energy-economy baseline provided by the HERMIN-Spain model and the Spanish energy plan after having rescaled the latter to the former.
The most salient aspect of the analysis performed is that the energy saving and emissions cutting margins embodied in the so-called PEN scenario (due to energy substitution and energy efficiency) are rapidly exhausted when growth accelerates, for example due to a CSF like shock. However, these margins also reveal the promising prospects of pro-growth strategies with high energy efficiency content. In this respect, it has to be taken into account that structural interventions, like those implemented in the CSF, admit naturally this content. In fact, a bunch of these interventions are directed towards energy and the environment although we have not analysed them in this work. This is an item in the our future research agenda.
References
- Antón, V. and A. de Bustos (1995): "La emisión de CO₂ y su problemática comunitaria. Un método de estimación general", Working Paper SGPS-D-95005. Dirección General de Planificación, Ministerio de Economía y Hacienda, Madrid.
- Antón, V., A. de Bustos, L. Manzanedo and V. Sierra (1992): "La emisión de CO₂ y su problemática comunitaria. Un método de estimación general", Working Paper SGPS-D-92007. Dirección General de Planificación, Ministerio de Economía y Hacienda, Madrid.
Bradley, J., J.A. Herce and L. Modesto (1995): "The Macroeconomic Effects of the CSF 1994-99 in the EU Periphery. An Analysis Based on the HERMIN Model", Economic Modelling, Vol. 12, pp.323-333.
Herce, J. A. and S. Sosvilla-Rivero (1995): "HERMIN-Spain", Economic Modelling, Vol. 12, pp.295-311.
- Herce, J. A. and S. Sosvilla-Rivero (1994): "The Effects of the Community Support Framework 1994-99 on the Spanish Economy: An Analysis Based on the HERMIN Model", Working Paper 94-10R, FEDEA, Madrid.
INE (1991): Tabla Input-Output de la Energía de España 1985 (Madrid: Instituto Nacional de Estadística).
Ministerio de Economía y Hacienda (1994): Plan de Desarrollo Regional (Madrid: Ministerio de Economía y Hacienda).
Solicitud de:
ENTIDAD:
Departamento:
Persona de contacto:
Dirección:
Código Postal: Población: Capital:
Teléfono: Fax:
Deseo recibir regularmente:
[ ] Colección Resúmenes
[ ] Textos Express
[ ] Documentos de trabajo
[ ] Boletín
Deseo recibir el Documento ....
Remitir esta solitud a:
FEDEA - Documentación
Jorge Juan, 46
28001 MADRID
Fax: (91) 577 95 75
Telf.: (91) 435 90 20
COLECCION RESUMENES
95-01: "Geografía económica y política territorial", CEP, FEDEA (Coordinador), IKEI e IVIE.
TEXTOS EXPRESS
96-01: "La Seguridad Social del siglo XXI y la reforma de las pensiones de 1996", José A. Herce.
95-02: "La reforma de las pensiones: Una encuesta rápida entre los analistas del sistema español", Coordinada por José A. Herce y Victor Pérez Díaz.
95-01: "Los problemas de la Sanidad en España: Una encuesta rápida entre los expertos en economía de la salud", Coordinada por José A. Herce, Juan Cabasés y Guillem López i Casasnovas.
DOCUMENTOS DE TRABAJO
96-06: "Environmental consequences of the Community Support Framework 1994-1999: Energy consumption and associated emissions in Spain. A HERMIN-model based evaluation", Vicente Antón, Andrés de Bustos, José A. Herce y Simón Sosvilla-Rivero
96-05: "El paro en España: Una encuesta a estudiosos del mercado de trabajo", Sonsoles Castillo, Rosa Duce y Juan F. Jimeno.
96-04: "Los sistemas mixtos de retribución como alternativa al pago por salario y su repercusión sobre la eficiencia del sistema sanitario", Marisol Rodríguez, Diego Rodríguez e Ignacio Abásolo.
96-03: "La creación de un mercado de medicamentos genéricos en España", Félix Lobo.
96-02: "La acreditación de hospitales: Un paso hacia la liberalización del mercado hospitalario español", Lluís Bohigas.
96-01: "La persistencia del paro: Economía y factores institucionales", Juan F. Jimeno.
95-26: "El crecimiento económico en España, 1964-1993: Algunas regularidades empíricas", Oscar Bajo y Simón Sosvilla-Rivero.
95-25: "Análisis de modelos alternativos de retribución de las oficinas de Farmacia", Ramón Gisbert, Joan Rovira y Rafael Illa.
95-24: "Teoría de los ciclos reales y fluctuaciones agregadas de la economía española", Luis A. Puch y Omar Licandro.
95-23: "La financiación hospitalaria basada en la actividad en sistemas sanitarios públicos, resulación de tarifas y eficiencia: El caso de la concertación hospitalaria en Cataluña", Guillem López i Casasnovas y Adam R. Wagstaff.
95-22: "Differential-difference equations in economics: On the numerical solution of vintage capital growth models", Raouf Boucekkine, Omar Licandro y Christopher Paul.
95-21: "Utilización del capital y ciclo económico español", Omar Licandro, Luis A. Puch y Ramón Ruiz-Tamarit.
95-20: "Empleo y sobrecualificación: El caso Español", José García Montalvo.
95-19: "Mecanismos óptimos de adjudicación de contratos públicos: La adquisición de material de telecomunicaciones y la venta del espectro de frecuencias de radio", Alessandro M. Manelli y Daniel R. Vicent.
95-18: "Regulación y eficiencia de la atención sanitaria primaria en España", Juan Gérvas y Vicente Ortún.
95-17: "La política de la reforma de los sistemas de pensiones", José-Luis Oller.
95-16: "Capital utilization, maintenance costs and the business cycle", Omar Licandro y Luis A. Puch.
Este texto se ha extraído automáticamente del documento original. Para citarlo o leerlo con su maquetación, descargue el PDF.
Descargar en PDF