Externalities and industrial growth: Spain 1978-1992*
by Juan J. de Lucio José A. Herce Ana Goicolea
DOCUMENTO DE TRABAJO 96-14
April, 1996
The authors wish to thank comments and suggestions made by Juan José Dolado and the participants at presentations of preliminary versions of this work held at FEDEA, the XI Jornadas de Economía Industrial, the XX Simposio de Análisis Económico and the 6th EEA Summer School, without implying any of them in remaining shortcomings. We also acknowledge the financial support of the Spanish Ministry of Public Works to a larger project, from which this paper is but a part, with several other participants to whom thanks are also due for useful interactions.
Fundación de Estudios de Economía Aplicada - FEDEA
FEDEA and Universidad Complutense of Madrid
Abstract
The paper discusses the role of static and dynamic externalities in promoting growth or industry location in Spanish provinces. We try to identify whether the dynamic externalities (technological spillovers) come from outside the industry (Jacobs) or they are generated between firms inside the industry (Marshall-Arrow-Romer). Moreover this study attempts to test the effects of competition on innovation and growth (Porter type external effects). Finally we develop simple models to check the presence of static locational economies and static urbanization economies.
The empirical analysis is made using data from the Spanish Industry Survey from 1978 to 1992 for 30 manufacturing branches. The evidence presented in the paper suggest that there are static urbanization economies, we obtain evidence of manufacturing crowding-in between the biggest industries in each territory and the rest. On the contrary we fail to capture any static localization economies.
Concerning dynamic externalities, we confirm, following the Glaeser et al (1992) approach, the presence of diversity (Jacobs) and competition (Porter) economies. We find no evidence of dynamic economies of specialization (MAR). According to these results technological spillovers take place mainly through cross fertilization between industries stemming out of their diversity. These findings are similar to the ones obtained by Glaeser et al. However, after controlling for individual effects, we obtain mixed evidence for diversity externalities.
JEL: R11, O30, O41,
1. Introduction
This paper applies to the Spanish industrial data the analysis carried out in Glaeser et al. (1992) to find evidence about the role of dynamic externalities influencing the growth of economic activities in the territory. It also extends the analysis to the search for static externalities influencing contemporaneously other patterns of activity. We restrict the analysis to up to thirty large industrial branches for the fifty Spanish provinces between 1978 and 1992. In section 2 we elaborate on the notion of externality as it is no evident, looking at the literature, what the appropriate definitions are. We propose a typology that guides the rest of the paper. Section 3 contains a description of the data and a discussion of the province-industry trends that emerge after a first exploitation of these data. Section 4 is devoted to the empirical analysis of externalities aiming at establishing evidence on these for the Spanish case.
Concerning dynamic externalities, we find evidence of a negative role for specialization (Marshall-Arrow-Romer type externalities), a positive role for competition (Porter type externalities) and mixed evidence for technological spillovers based on cross-fertilization (diversity or Jacobs type externalities). On the other hand, as for static externalities, we are only able to find evidence for urbanization ones explaining the diversity of activities within a territory.
2. Development and agglomeration of economic activities
2.1. The agglomeration process: localization and urbanization
The localization of homogeneous or vertically integrated activities in a given territory is often the consequence of the existence of specific productive factors ranging from natural resources or landscapes to qualified labour accumulated due to previous specialization of certain industries. The presence of certain highly specific inputs is thus a strong feature of a type of process of localization by which a territory ends up by specializing its economic activities. In what follows we will use the term ‘localization’ in this precise sense.
On the other hand, in a given territory, very diverse activities may develop or be attracted to it because of the need to supply all kind of goods and services to a large population, i.e. due to the existence of developed output markets. In this sense we will refer to the urbanization process and use the term ‘urbanization’ correspondingly.
In a very stimulating paper, Livas and Krugman (1992) describe the circular selfreinforcing process by which the forces linked to the existence of inputs markets, called ‘forward linkages’, act together with the forces linked to the existence of output markets, called ‘backward linkages’. Such interactions may favour the agglomeration of activities in a territory or a city and thus its growth or, in the opposite case, its decline. The term agglomeration refers here to the result of a balance of different acting forces of which the localization and urbanization processes previously mentioned are the most evident representatives.
2.2. Externalities
The territory, thus, due to the economic activity it holds, its population and other characteristics is a source of externalities that influence its evolution. Economic activity has always a propensity to concentrate due to the advantages stemming out of geographic proximity. An extensive literature approaches this evidence attempting to analyze the most important factors determining the location of firms.
Traditional localization theories centred the attention on the differences in comparative advantages across regions. According to these theories, the most influential factors for location were based on the existence of natural resources in a certain location, tax cuts, wages differentials, market size, etc.
Undoubtedly, these factors are still important in determining industry location, although the deep changes occurred during the last decades, like the globalization of industry and the rapid technological change, have rendered them less relevant. Recently, there has been relevant contributions to the study of industrial location and growth in the fields of economic geography and industrial economics.
Krugman (1991) views regional economic growth as a cumulative process deriving from a set of initial advantages. Once a region has grown sufficiently, growth tends to persist. Economic concentration is a result of three types of factors. In the first place it is due to economies of scale in production, which implies the existence of imperfect competition. These economies of scale are not linked to territory. In the second place, it is due to the size of the local market, and, lastly, to transportation costs. Consequently, a firm will try to provide the local market from an unique location from which it minimizes transportation costs.
Henderson (1992, 1994), Henderson et al. (1995) and Glaeser et al. (1994) present insightful contributions for the study of industrial location. These authors stress the role played by externalities associated with knowledge spillovers for economic growth. Knowledge spillovers refer to the transfer of ideas and information among firms that comes with geographical proximity. Firms gain knowledge without paying for it, the productivity growth of one firm increases the productivity of others without full compensation and consequently these knowledge spillovers are considered externalities. Because these externalities contribute to industrial growth they are termed 'dynamic externalities'.
In a world characterized by the globalization of markets and increasing competition, knowledge externalities are the engine of growth of regions. A strategy based on continuous innovation is increasingly relevant to gain or maintain competitive advantages, and innovation more than any other activity depends on knowledge. Although analysis of innovation usually has been confined to the interior of a firm, external sources of knowledge, as a factor that affects the capacity to innovate, has gradually gained acceptance. In an uncertain environment, the capacity to innovate is fostered through the transfer of information. Firms engage in networks that facilitate communication and information spilling. These networks are most often local and are a reflection of interpersonal contacts and mutual trust that develop over the years (Henderson, 1992). Geographic proximity does not guarantee the transmission of ideas but it makes it easier.
In the economic geography and industrial economics literature there seems to be widespread agreement on the role played by dynamic externalities, however there is a debate about whether these derive from other firms of the same industry or from the diversity of industries in a region. If externalities derive from other firms of the same industry they are termed MAR externalities, after Marshall, Arrow and Romer. Marshall's references to the atmosphere of industrial districts where the 'mysteries of industry are in the air' (Marshall, 1890) imply benefits from knowledge sharing among firms of an industry: "When an industry has chosen a locality for itself, it is likely to stay there long; so great are the advantages which people following the same skilled trade get from near neighbourhood to one another. The mysteries of the trade become no mysteries; but are as it were in the air, and children learn many of them unconsciously. Good work is appreciated, inventions and improvements in machinery, in process and the general organization of the business have their merits promptly discussed; if one man starts a new idea, it is taken up by other and combined with suggestions for their own; and thus it becomes the source of further new ideas. And presently subsidiary trades grow up in the neighbourhood, supplying it with implements and materials, organizing its traffic, and in many ways conducting to the economy of its material".
Arrow (1962) presented an early formalization of the knowledge externalities; Romer (1986) followed Arrow's line of work with an influential paper where he argues that the presence of externalities accruing to knowledge create spatial differences in the distribution of economic activity.
There is a high number of empirical studies that show evidence of this type of intra-industry externalities on industries such as micro-chips in Silicon Valley (Saxenian, 1994), the film industry in Hollywood (Storpper and Christopherson, 1987), the micro-electronics industry in the Swiss Jura (Maillat et al, 1995) and the shoe industry in the Spanish region of Valencia (Vázquez Barquero and Saez, 1995).
When dynamic externalities come from firms from different industries, they are called Jacobs' externalities. Jane Jacobs (1969) states that the most important knowledge spillovers come from other firms outside the considered industry. An example of this kind of externality is the clothing industry that is related with industrial machinery, textile industry, financial institutions, etc... An innovation in one of these industries can increase productivity of the clothing industry. According to this theory, very diversified territories will tend to grow faster.
MAR and Jacobs externalities also differ on the effects of local competition on the transmission of information among firms. MAR externalities may provoke that the lack of compensation for knowledge inhibits innovation. According to this, monopoly is better for growth since it restricts knowledge transfer and permits the innovator to internalize externalities. On the other hand, Jacobs (1969) argues that strong competition induces firms to innovate in order to remain competitive, which results in an increase in knowledge.
Porter's work (1990) agrees with Jacobs that competition is better for growth. However, he argues that knowledge spillovers take place specially among firms belonging to the same industry. This leads us to consider a third type of dynamic externality that we will name Porter externality.
There may be also other externalities that explain regional specialization and urbanization but not growth. For example the existence of abundant natural resources that are costly to transport, or a locality with high local demand. These factors can determine an industry's location or an increase in productivity, but they cannot by themselves generate a sustained process of growth, it is subsequent specialization, diversity or competition what may eventually induce growth. The effects of the former factors are simultaneous to the existence of the externality. We call these type of externalities static.
The location of homogeneous activities in a territory is linked to the existence of certain production factors such as natural resources or a labour force with specific qualifications for an industry. The existence of highly developed input markets is thus a distinctive characteristic of a localization process consistent in the economic specialization of a territory. In this study the term 'economies of localization' will be used in this sense. On the other hand, a territory may attract different activities due to the need to supply a large population with all kinds of goods and services, that is, due to the existence of developed output markets. In this sense we refer to economies of urbanization.
It is thus important to distinguish static and dynamic externalities. The first determine concentration or industrial diversification in a territory, the second the growth of the activity in that territory. Often industrial concentration or diversification determines industrial growth, but not necessarily nor exclusively. Table 1 presents a summarized classification of the externalities just described.
| Table 1 | |||
| Predominant type of market | Technological spillovers | No technological spillovers | |
| Inputs market | Intra-industry | MAR dynamic externalities (imitation) | Localization static externalities (specialization) |
| Inter-industry | Jacobs dynamic externalities (cross fertilisation) | ||
| Outputs market | Urbanization static externalities (diversity) | ||
2.3. Specialization, diversity and competition
In order to measure these externalities we use the following measures.
The index used to measure an industry specialization in a territory for a given year is the fraction of the share of the industry employment in this region over the share of the total national industry employment. This is the same index used by Glaeser et al (1992).
\[s _ {i j} = \frac {L _ {i j} / L _ {j}}{L _ {i} / L}\tag{3}\]
where:
is the employment in the industry in the region .
is the employment in the industry .
is the employment in the region .
is the total national employment.
For a region, the greater is the index s the greater is the employment concentration in that industry. For instance an index of specialization equal to two means that in this region the industry has a proportion of employment that is twice the proportion of the national employment in the industry.
To measure diversity we used the Hirschman-Herfindahl index The index is equal to the sum of the square proportions of employment of all the industries that are present in a region.
\[\nu_ {j} = \sum_ {\forall i} \left(\frac {L _ {i j}}{L _ {j}}\right) ^ {2}\tag{4}\]
The lower the index is the greater the diversity. Both a homogeneous distribution of the employment among industries and a greater number of industries in the region make this index lower.
Additionally we defined external diversity to an industry as the same index defined over the rest of industries in the region:
\[v _ {i j} = \sum_ {k + i} \left(\frac {L _ {k j}}{L _ {j} - L _ {i j}}\right) ^ {2}\tag{4a}\]
In order to isolate this index from the effect of the number or industries present in a region we can use the same index defined over the top n industries in the region.
\[v _ {j} = \sum_ {k} \left(\frac {L _ {k , j}}{L _ {j}}\right) ^ {2} \quad k = t o p n i n d u s t r i e s \quad i n t h e r e g i o n\tag{4b}\]
We use the same index of competition as Glaeser et al (1992)
\[c _ {i j} = \frac {N _ {i j} / L _ {i j}}{N _ {i} / L _ {i}} = \frac {L _ {i} / N _ {i}}{L _ {i j} / N _ {i j}}\tag{5}\]
where is the number of establishments (in the industry i in the region j). We should use number of firms, but this is not available, so we used establishments. The deviations of the index using establishments are not significant because establishments and number or firms has a constant relation through industries and time. When c is greater than one it means that the industry in this city has more firms relative to its size than the national average.
3. Territorial patterns of industrial activity in Spain
3.1. The data
The data source used for the industrial growth, localization and urbanization models (see sections below) is the Encuesta Industrial (Industrial Survey) produced by the Instituto Nacional de Estadística (INE, Spanish Statistical Office). The data is referred to 30 industrial groupings which are directly surveyed by the INE (or non-delegated) for the period 1978 to 1992. The data set contains information on gross value added, production, employment, personal costs and number of establishments by industrial grouping and by province. Table 2 lists the 30 non-delegated industrial groupings from the Encuesta Industrial.
The transmission of data from INE to users must comply to the statistical secret guaranteed by the survey. Due to the high sectoral and territorial desegregation of the data requested, it is possible that a considerable number of industrial groupings will have a reduced number of establishments belonging to a single firm and it may be easily recognizable even after applying the corresponding elevation factors. In these cases, for confidentiality reasons INE will provide a missing value for the observation. The incidence of missing data can be observed in Table 3. The percentage of missing values is 27,5% of the total number of observations for 1992, which represents from 3,13% of the total employment to 5,84% of total gross production.
| Table 2 | |
| N° | Description of the industrial groupings |
| 1 | Water |
| 2 | Production and first transformation of metals |
| 3 | Materials for building and construction and non metallic minerals |
| 4 | Glass products and ceramics |
| 5 | Petrochemistry, organic and non organic chemistry |
| 6 | Plastics and synthetic fibres |
| 7 | Fertilizers and paintings |
| 8 | Other industrial chemical products |
| 9 | Pharmaceutical products |
| 10 | Other final consumption chemical products |
| 11 | Metal mills |
| 12 | Metallic products and metalworks |
| 13 | Agricultural and industrial machinery and equipment |
| 14 | Office equipment |
| 15 | Electric machinery and materials |
| 16 | Electronic materials, precision and optics |
| 17 | Vegetables and fish preserves |
| 18 | Flour mills, bread and pastry |
| 19 | Food products and tobacco |
| 20 | Alcohol and drinks |
| 21 | Textiles |
| 22 | Leather and shoes |
| 23 | Apparel |
| 24 | Wood, kork and derivatives |
| 25 | Furniture |
| 26 | Paper and derivates |
| 27 | Printing |
| 28 | Plastic derivates |
| 29 | Toys |
| 30 | Other manufactures |
| Table 3Incidence of missing values | ||
| Variable | % over n° totals | |
| 1978 | 1992 | |
| N. of workers employed | 3.0 | 3.1 |
| Labour costs | 3.7 | 4.2 |
| Gross production | 5.0 | 5.8 |
| Value added | 4.5 | 4.8 |
| N. of observations | 25.3 | 27.5 |
3.2. Value added, employment and labour costs
It is not easy to present the data set used from the Spanish Industrial Survey due to the high sectoral and territorial disaggregation. We have decided to maintain the province level and, in this section, present aggregated data by sectors for a limited number of variables. It is important to note that our data set refers only to the sectors directly surveyed by INE. The difference in employment between total industry and our data set is approximately half a million workers.
The first thing that strikes out from the data is the very high employment destruction. Between 1978 and 1992, 709.948 employments were lost, 613.470 within our data set. As can be observed in figure 1, within the period considered, employment loss was most severe during the first half of the 80s decade. From 1986 to 1990 employment picked up by approximately 100.000 and then it began to descend again more slowly, following a standard cycle. The pattern followed by our data set and the total manufacturing employment has been very similar.
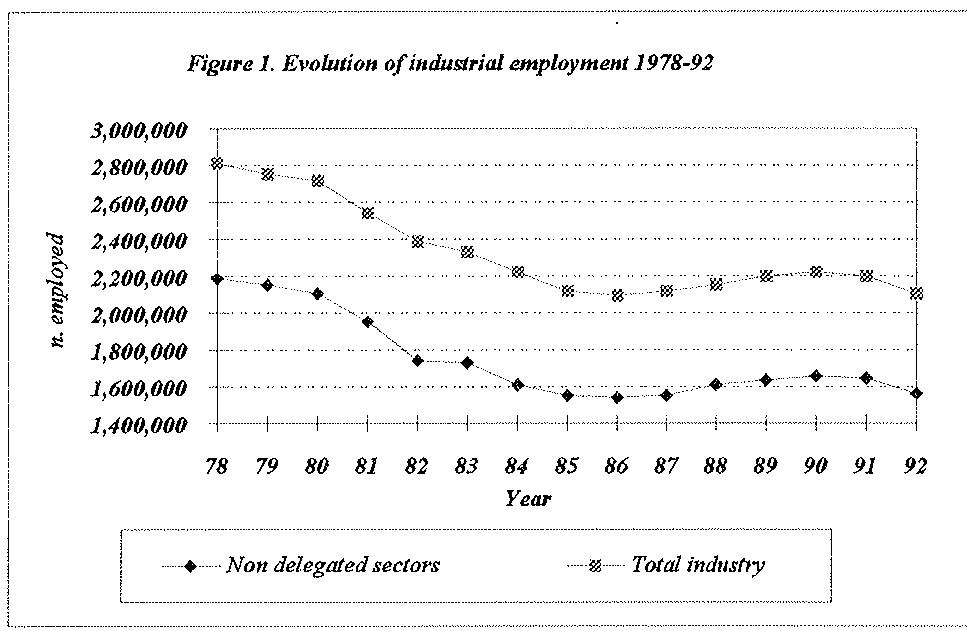
Table 4 describes the six largest and smallest provinces in terms of industrial employment and the five largest industries within them. These largest and smallest industrial provinces were also the largest and smallest in 1978 although their position in this ranking was altered, i.e. Guipuzcoa placed 6th in 1978 and 5th in 1992. Spanish manufacturing activity is mainly concentrated in the province of Barcelona with 320.551 industrial workers. The second largest industrial concentration, far from Barcelona, is Madrid with 185.447 workers. The six largest provinces alone (Barcelona, Madrid, Valencia, Vizcaya, Alicante and Gipuzcoa) have over half of the country's employment in industry (53%). The smallest provinces in terms of industry employment are Soria and Guadalajara both with less than 3.000 employees in 1992. Note that these figures only include the industrial sectors directly surveyed by the Instituto Nacional de Estadística. The largest industries in each province are very diverse, although there are some sectors that have a large number of employees in most provinces like Metallic products and metalworks or Plastic derivatives.
| Table 4Spanish provinces with the highest and lowest industrial employment | |||
| Province | Employment in 1978 | Employment in 1992 | 5 highest employment industries in 1992 |
| The six highest (employment in 1992) | |||
| Barcelona | 473,334 | 320,551 | Textiles; Metallic products and metalworks; Plastic derivatives; Electric machinery and materials; Printing. |
| Madrid | 274,445 | 185,447 | Printing; Metallic products and metalworks; Electronic materials; precision and optics; Apparel; Agricultural and industrial machinery and equipment. |
| Valencia | 154,626 | 123,434 | Furniture; Metallic products and metalworks; Apparel; Flour mills; bread and pastry. |
| Vizcaya | 128,692 | 72,719 | Metallic products and metalworks; Production and first transformation of metals; Metal mills; Agricultural and industrial machinery and equipment; Plastic derivates. |
| Guipuzcoa | 95,219 | 63,097 | Metallic products and metalworks; Agricultural and industrial machinery and equipment; Electric machinery and materials; Metal mills; Plastic derivates. |
| Alicante | 104,276 | 60,161 | Leather and shoes; Textiles; Plastic derivates; Flour mills, bread and pastry; Metallic products and metalworks. |
| The six lowest (employment in 1992) | |||
| Cuenca | 5,722 | 3,856 | Apparel; Metallic products and metalworks; Flour mills, bread and pastry; Wood, kork and derivates; Alcohol and drinks. |
| Teruel | 5,455 | 3,748 | Apparel; Wood, kork and derivates; Materials for building and construction and non metallic minerals; Metallic products and metalworks; Glass products and ceramics. |
| Avila | 3,137 | 3,634 | Flour mills, bread and pastry; Water; Metallic products and metalworks; Apparel; Plastic derivates. |
| Zamora | 4,628 | 3,179 | Flour mills, bread and pastry; Materials for building and construction and non metallic minerals; Water; Vegetables and fish preserves; Metallic products and metalworks. |
| Guadalajara | 4,155 | 2,808 | Flour mills, bread and pastry; Apparel; Wood, kork and derivates; Furniture; Water. |
| Soria | 3,829 | 2,351 | Furniture; Wood, kork and derivates; Flour mills, bread and pastry; Water, Metallic products and metalworks. |
Table 5 shows the 10 largest province-industry in our data set. The largest province-industry is textiles in Barcelona with over 40.000 employees. Eight out of the tenth largest province-industries are in Barcelona and the other two are in Madrid.
| Table 510 highest employment province-industry in 1992 | ||
| Province | Sector | employment |
| Barcelona | Textiles | 42,318 |
| Barcelona | Metallic products and metalworks | 33,993 |
| Madrid | Printing | 27,571 |
| Barcelona | Plastic derivates | 24,188 |
| Barcelona | Electric machinery and materials | 22,993 |
| Barcelona | Printing | 20,000 |
| Barcelona | Ag. & industrial machinery and equipment | 19,891 |
| Madrid | Metallic products and metalworks | 19,888 |
| Barcelona | Pharmaceutical products | 19,276 |
| Barcelona | Apparel | 18,240 |
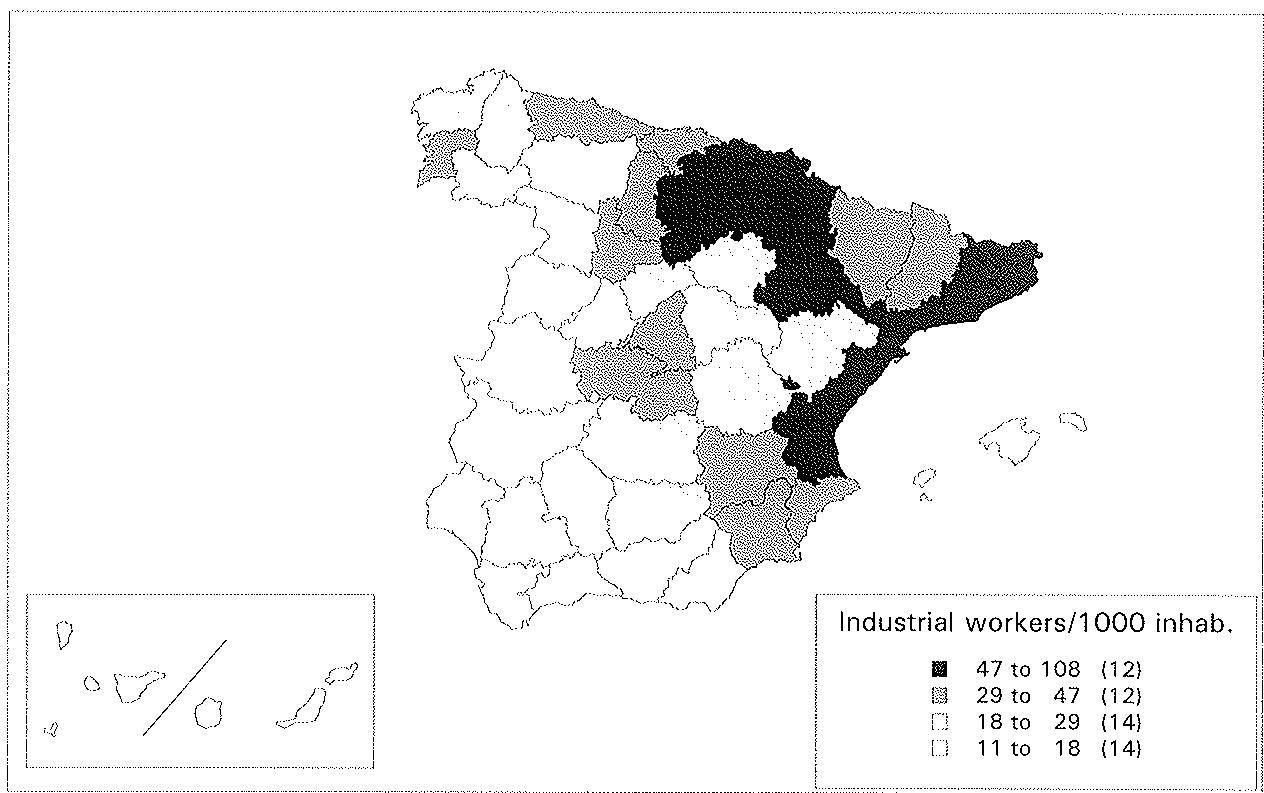
Table 6 presents for 1992 the number of industrial workers for all Spanish provinces, the percentage that they represent over province's population, and the change in the number of industry workers between 1978 and 1992. Table 6 also includes average personnel costs and gross value added per employee. The data in this Table has been sorted out according to the number of workers in industry. The highest percentage of industrial workers over the province's population corresponds to Alava with 107 industrial workers per 1000 inhabitants, while the lowest is Almería with only 12. Figure 2 shows the territorial pattern of industry. Spain's most industrialized provinces are located along the East (Mediterranean axis) and the North East (Ebro axis and Cantabric Axis).
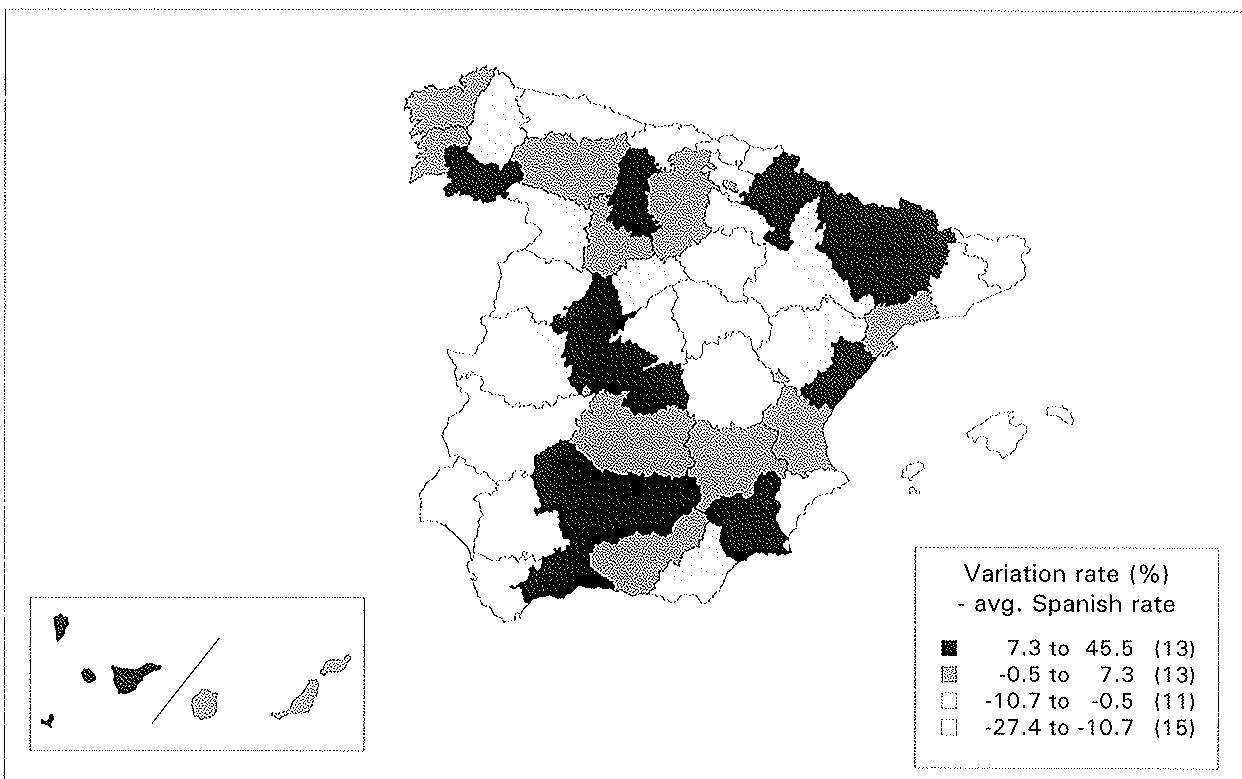
With respect to industrial employment change during the period 1978 to 1992, in the industrial groupings considered, only 4 provinces out of 50 have created net industrial employment, these are Orense, Avila, Lerida and Huesca, all four of them have little industrial employment. The rest have experimented net industrial employment loss, and 26 provinces have lost more than the national average that is -21.57%. The provinces with more industry were generally the ones that experimented greater job losses (see figure 3).
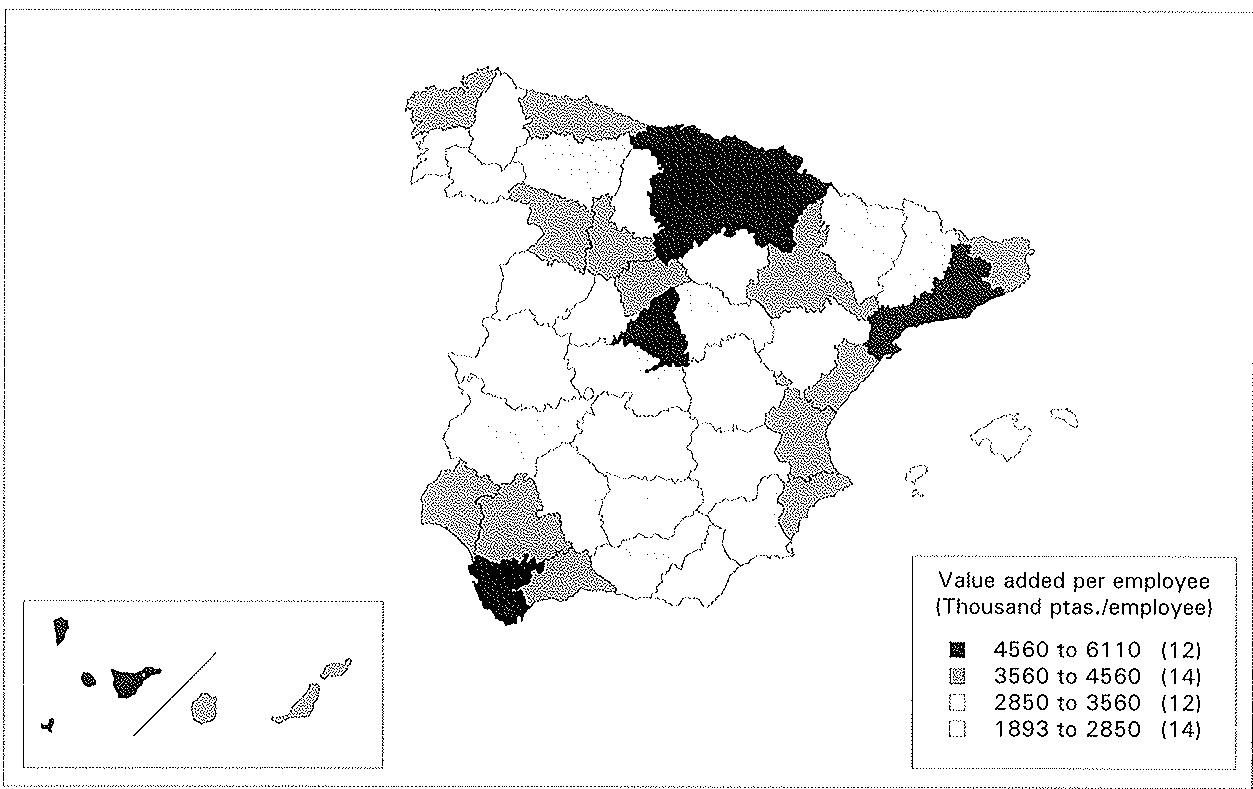
In Table 6 and figure 4 we can also observe the wide differences in the gross value added per worker, that range from a maximum of 6.1 million ptas. per worker in Burgos to only 1.9 in Lugo, whereas the average personnel costs presents a much smaller variation from 3.5 thousand pta/worker in Guipuzcoa to 1.1 in Avila. This reflects the existence of economic activity with very different value added across territories, and the fact that differences in remuneration must account not only for productivity but also for the cost of living in a certain territory.
Table 6. Industrial employment, productivity and average personnel costs, 1992.
| Province | Employment | Emp. 1000 inhabitants | Gross V.A. per employee (1) | Labour cost per employee (1) | Employment change |
| BARCELONA (B) | 320,551 | 69 | 5,321 | 3,135 | -32.3 |
| MADRID (M) | 185,447 | 37 | 5,755 | 3,310 | -32.4 |
| VALENCIA (V) | 123,434 | 58 | 3,660 | 2,161 | -20.2 |
| VIZCAYA (BI) | 72,719 | 63 | 4,686 | 3,461 | -43.5 |
| GUIPUZCOA (SS) | 63,097 | 93 | 4,887 | 3,538 | -33.7 |
| ALICANTE (A) | 60,161 | 46 | 3,750 | 2,066 | -42.3 |
| ZARAGOZA (Z) | 47,758 | 57 | 4,553 | 2,706 | -27.7 |
| MURCIA (MU) | 42,787 | 41 | 3,304 | 1,780 | -14.0 |
| NAVARRA (NA) | 41,104 | 79 | 4,564 | 2,869 | -13.6 |
| ASTURIAS (O) | 39,807 | 36 | 3,729 | 3,101 | -37.8 |
| SEVILLA (SE) | 35,276 | 22 | 4,461 | 2,504 | -32.4 |
| CASTELLON (CS) | 34,501 | 77 | 4,556 | 2,463 | -5.8 |
| GERONA (GE) | 30,502 | 59 | 4,406 | 2,418 | -33.5 |
| TARRAGONA (T) | 30,037 | 55 | 5,698 | 2,638 | -19.8 |
| ALAVA (VI) | 29,759 | 107 | 5,266 | 3,533 | -24.1 |
| CORUNA (C) | 28,907 | 26 | 4,097 | 2,195 | -15.5 |
| PONTEVEDRA (PO) | 28,773 | 32 | 3,001 | 1,882 | -18.8 |
| CANTABRIA (S) | 24,182 | 46 | 4,738 | 2,971 | -37.0 |
| TOLEDO (TO) | 20,566 | 42 | 3,416 | 1,758 | -12.5 |
| MALAGA (MA) | 19,698 | 17 | 4,052 | 2,138 | -10.2 |
| BURGOS (BU) | 19,672 | 56 | 6,105 | 2,868 | -16.8 |
| CORDOBA (CO) | 18,434 | 24 | 3,206 | 1,799 | -1.1 |
| RIOJA (LO) | 18,288 | 69 | 5,356 | 2,286 | -25.9 |
| BALEARES (PM) | 17,390 | 24 | 3,113 | 1,855 | -34.0 |
| LERIDA (L) | 16,541 | 47 | 3,526 | 1,867 | 14.6 |
| CADIZ (CA) | 16,518 | 15 | 4,788 | 2,313 | -28.0 |
| VALLADOLID (VA) | 14,923 | 30 | 4,418 | 2,605 | -19.7 |
| JAEN (J) | 14,451 | 22 | 2,987 | 1,658 | -6.3 |
| ALBACETE (AB) | 12,967 | 37 | 2,628 | 1,570 | -15.6 |
| PALMAS (GC) | 12,061 | 15 | 3,795 | 2,137 | -18.3 |
| GRANADA (GR) | 11,618 | 15 | 3,247 | 1,833 | -20.6 |
| CIUDAD REAL (CR) | 11,517 | 24 | 2,838 | 1,571 | -14.3 |
| TENERIFE (TF) | 10,217 | 14 | 5,236 | 2,162 | -8.9 |
| LEON (LE) | 9,388 | 18 | 3,038 | 1,614 | -20.9 |
| ORENSE (O) | 8,505 | 24 | 2,659 | 1,609 | 23.9 |
| BADAJOZ (BA) | 8,119 | 12 | 2,909 | 1,489 | -38.2 |
| HUESCA (HU) | 7,397 | 35 | 3,403 | 1,752 | 1.0 |
| LUGO (LU) | 7,003 | 18 | 1,893 | 1,110 | -23.7 |
| PALENCIA (P) | 6,923 | 37 | 2,591 | 2,015 | -10.5 |
| HUELVA (H) | 6,826 | 15 | 3,948 | 2,474 | -29.5 |
| SALAMANCA (SA) | 5,969 | 17 | 2,655 | 1,482 | -48.9 |
| CACERES (CC) | 5,749 | 14 | 2,610 | 1,429 | -27.8 |
| ALMERIA (A) | 5,502 | 12 | 2,847 | 1,540 | -22.1 |
| SEGOVIA (SG) | 4,270 | 29 | 3,602 | 1,763 | -29.6 |
| CUENCA (CU) | 3,856 | 19 | 2,490 | 1,269 | -32.6 |
| TERUEL (TE) | 3,748 | 26 | 2,803 | 1,726 | -31.3 |
| AVILA (AV) | 3,634 | 21 | 2,016 | 1,070 | 15.8 |
| ZAMORA (ZA) | 3,179 | 15 | 3,561 | 1,390 | -31.3 |
| GUADALAJARA (GU) | 2,808 | 19 | 3,291 | 1,822 | -32.4 |
| SORIA (SO) | 2,351 | 25 | 2,506 | 1,432 | -38.6 |
| Maximum | 320,551 | 107 | 6,105 | 3,538 | 23.9 |
| Minimum | 2,351 | 12 | 1,893 | 1,070 | -48.9 |
| Average | 31,378 | 36 | 3,759 | 2,123 | -21.6 |
| Standard deviation | 52,542 | 22 | 1,032 | 639 | 15.0 |
(1) Thousand pesetas. Source: Encuesta Industrial. Instituto Nacional de Industria.
3.3. Industrial specialization and diversity
Table 7 contains some summary statistics of the distribution of diversity, competition and specialization indexes by province as well as their value in the fastest and slowest growing provinces. It is striking the fact that in the five fastest growing province-industries employment has increased more than four times while the hardest hit province-industries have almost disappeared having seen their employment reduced in 1992 to around one tenth of what it was in 1978.
| Table 7 Employment growth (1978-1992), diversity, competition and specialization in the five fastest and five slowest growing Spanish province-industries | ||||
| Employment growth (1) | Diversity in 1978 (2) | Competition in 1978 | Specializa. in 1978 | |
| Five fastest growing province-industries | ||||
| Alicante-Fertilizers and paintings | 5.14 | 0.16 | 16.39 | 0.02 |
| Avila-Water | 4.55 | 0.15 | 1.58 | 4.02 |
| Granada-Leather and shoes | 4.48 | 0.12 | 19.50 | 0.05 |
| Albacete-Glass and ceramics | 4.39 | 0.13 | 9.13 | 0.11 |
| Orense-Water | 4.38 | 0.14 | 2.00 | 0.57 |
| Five slowest growing province-industries | ||||
| Las Palmas-Electric mach. and eq. | 0.11 | 0.08 | 2.63 | 1.21 |
| Lugo-Apparel | 0.11 | 0.11 | 12.09 | 0.89 |
| Pontevedra-Leather and shoes | 0.10 | 0.09 | 3.73 | 0.15 |
| Alava-Textiles | 0.09 | 0.12 | 0.75 | 0.27 |
| Soria-Food products and tobacco | 0.07 | 0.14 | 3.06 | 2.27 |
| Summary statistics | ||||
| Average | 0.91 | 0.11 | 1.98 | 1.48 |
| Standard deviation | 0.59 | 0.04 | 2.56 | 2.12 |
| Highest | 5.14 | 0.27 | 28.56 | 39.29 |
| Median | 0.78 | 0.11 | 1.21 | 0.97 |
| Lowest | 0.07 | 0.06 | 0.07 | 0.02 |
| (1) Employment in 1992/employment in 1978.(2) Higher value of the index means less industrial diversity as computed with expression (4a). | ||||
The relationship between industry growth and diversity, competition and specialization cannot be completely established from the data contained in Table 7, but more competition seems to be correlated with higher industry growth, more specialization with industrial decline while no obvious pattern emerges for diversity. This indicator has the most balanced distribution of all whereas specialization and competition have considerably less balanced distributions.
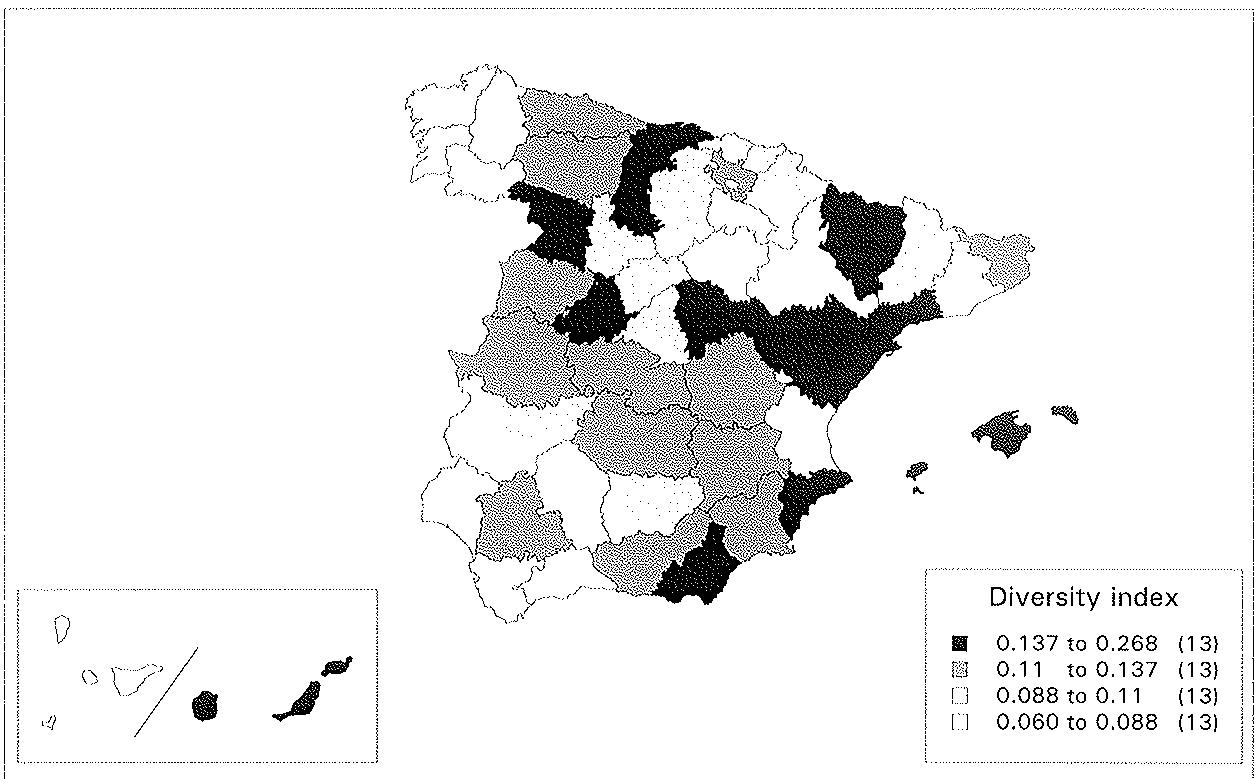
Figure 5 shows the industrial diversity of Spanish provinces as computed using expression (4) above. It is apparent that, when comparing this with graphic 2, the Spanish pattern of industrialization is weakly influenced by industrial diversity, at least at present.
4. Externalities in Spanish industry
4.1. The general model
To check the presence of the externalities discussed in the previous sections we use the model employed by Glaeser et al (1992). We suppose that a firm in a industry in a given location has a production function given by:
\[Y _ {t} = A _ {t} L _ {t} ^ {1 - \alpha}\tag{6}\]
where output is a function of only one input, labour.
The first order condition makes the marginal product of labour equal to the wage rate:
\[(1 - \alpha) A _ {t} L _ {t} ^ {- \alpha} = W _ {t}\tag{7}\]
This equation can be written in terms of growth rates between any base year, that we call year 0, and any year t:
\[\alpha \log \left(\frac {l _ {t}}{l _ {0}}\right) = \log \left(\frac {A _ {t}}{A _ {0}}\right) - \log \left(\frac {w _ {t}}{w _ {0}}\right)\tag{8}\]
In are contained all the factors influencing the firm's activity but own wages and employment. Such factors can be shared by the rest of the economy or be specific to a territory, industry, etc. In the last cases, productivity growth in a given period due to local factors may depend on specialization, diversity or other initial local conditions:
(9)
4.2. Dynamic externalities
Based on expressions (8) and (9), we estimate the following equation in order to establish the presence or not of dynamic externalities, i.e. the fact that certain local initial conditions having to do with specialization, diversity, etc may determine growth of industrial activities in a territory :
\[\log \left(\frac {l _ {i j t}}{l _ {i j 0}}\right) = a + b _ {1} \log \left(\frac {l _ {i t} - l _ {i j t}}{l _ {i 0} - l _ {i j 0}}\right) + b _ {2} w _ {i j 0} + b _ {3} l _ {i j 0} + b _ {4} s _ {i j 0} + b _ {5} c _ {i j, 0} + b _ {6} v _ {i j, 0}\tag{10}\]
in which the term multiplied by is controlling for industry-wide shocks. Note that the growth of wages present in equation (8) has disappeared as we are assuming that this is following an industry-wide pattern already influencing industry-wide employment growth. S stands for specialization as measured in any base year, c for competition and v for industrial variety or diversity. If were positive it means that there are specialization externalities or MAR economies explaining growth. A positive sign for means that there exists a Porter effect; that is, more competition fosters growth. Finally if is negative this implies knowledge spillovers of the kind indicated by Jacobs.
In order to perform panel estimation on expression (10) we have treated several sub-periods between 1978 and 1992 so that growth in each sub-period has been related to initial conditions at its beginning.
Estimation results by OLS are shown in Table 8. It can be seen that after controlling, quite effectively, for industry-wide employment variation and certain initial conditions, specialization seems to cause industrial decline while competition and diversity influence industrial growth. This irrespective of the number of sub-periods chosen although the best results are obtained for growth measurements over 7 years indicating that, in particular, Jacobs type externalities reach maturity somewhere between 5 and 10 years. These results are fully in line with those obtained by Glaeser et al (1992).
| Table 8Dynamic externalities model. OLS estimationDependent Variable: Employment growth in province-industry in x years time (1) | ||||
| Employment growth in x years time (1) | ||||
| 14(1 period) | 10(5 periods) | 7(8 periods) | 5(10 periods) | |
| Intercept | 0.001(0.01) | -0.020(0.55) | 0.022(0.83) | -0.01(0.50) |
| Employment growth outside the province-industry | 0.86(12.17) | 0.85(22.71) | 0.90(32.57) | 0.88(33.30) |
| Employment in the province-industry in the base year (in millions) | -5.6(1.74) | -3.99(2.48) | -3.26(2.50) | -2.22(1.95) |
| Wage in the province-industry in the base year (in millions pts. 1978) | 0.051(0.48) | 0.083(1.99) | 0.050(1.52) | 0.048(1.91) |
| Specialization in the base year | -0.012(1.40) | -0.015(4.30) | -0.012(4.50) | -0.009(4.19) |
| Competition in the base year | 0.030(3.40) | 0.039(15.09) | 0.035(18.86) | 0.028(17.86) |
| Diversity in the base year | -0.59(1.32) | -0.73(4.37) | -0.82(6.43) | -0.52(4.83) |
| Adjusted $R^2$ | 0.16 | 0.16 | 0.18 | 0.15 |
| n. obs. | 867 | 4368 | 6992 | 8767 |
| (1) Log (Employment in t / Employment in t-x) | ||||
When we perform panel data estimation, which is indicated given the presence of non equal individual effects in the data as suggested by the F test values of Table 9, results are kept for specialization and competition dynamic externalities while we are only able to find Jacobs type externalities in the random effects models although the value of the Hausman test implies that the individual effects are correlated with the regressors and imposes the fixed effects models as the proper estimation method. In this case, estimators are not significant nor have they often the expected sign. In our data, however, 'individuals' are of a peculiar nature being characterised by a double sectoral and territorial dimension that complicates the use of individual effects. The results of table 9 have been obtained after controlling by these double-sided individual effects.
| Table 9Dynamic externalities model. Panel data estimation (province-industry individual effects)Dependent Variable: Employment growth in province-industry in x years time (1) | ||||||
| x=10 (5 periods) | x=7 (8 periods) | x=5 (10 periods) | ||||
| Fixed effects | Random effects | Fixed effects | Random effects | Fixed effects | Random effects | |
| Intercept | -0.20(4.27) | - | -0.04(1.06) | - | -0.06(1.79) | |
| Employment growth outside the province-industry | 0.72(13.96) | 0.80(19.26) | 0.83(30.08) | 0.88(34.85) | 0.80(29.73) | 0.86(34.36) |
| Employment in the province-industry in the base year (millions) | -64.9(9.25) | -10.4(3.84) | -50.4(9.70) | -9.22(3.95) | -48.6(10.3) | -5.65(2.90) |
| Wage in the province-industry in the base year (in millions pts. 1978) | 0.45(5.00) | 0.33(5.69) | 0.08(1.09) | 0.17(3.64) | -0.089(1.35) | 0.11(3.01) |
| Specialization in the base year | -0.15(17.46) | -0.06(12.30) | -0.23(27.48) | -0.07(14.75) | -0.21(27.36) | -0.04(11.65) |
| Competition in the base year | 0.08(18.77) | 0.06(19.06) | 0.08(26.26) | 0.05(24.14) | 0.08(28.38) | 0.04(23.42) |
| Diversity in the base year | 0.25(1.04) | -0.10(0.50) | -0.22(0.92) | -0.56(3.14) | 0.15(0.64) | -0.40(2.59) |
| Adjusted R2 | 0.66 | 0.50 | 0.54 | 0.37 | 0.39 | 0.22 |
| n. obs. | 4368 | 4368 | 6992 | 6992 | 8767 | 8767 |
| d.o.f. | value | d.o.f. | value | d.o.f. | value | |
| F test. H0: equality of individual effects | (1001, 3360) | 7.49 | (1039, 5946) | 15.60 | (1051, 7709) | 4.25 |
| Hausman test. H0: ind. of i. effects | (6) | 409.87 | (6) | 985.14 | (6) | 1236.1 |
| (1) Log (Employment in t / Employment in t-x). | ||||||
We have also obtained panel data estimates after correcting the data so that the individual effects correspond to industries irrespective of the province rather than to province-industries as before. That is, in estimating the fixed and random effects models, we subtract from each observation the average value of the variable for the industry nation-wide over the specified time period. This transformation of data assumes that individual effects are identical for any given industry across provinces and thus we are only controlling for industry specific characteristics. In this case we have 30 different individual effects, as many as industrial groupings, for each time period along which we are measuring industrial growth. Table 9b presents the results using this transformation of data. The effects are close to those obtained with the OLS estimates: a positive effect of competition and diversity (evidence of Jacobs and Porter economies) and a negative effect of specialization (no evidence of dynamic specialization economies). As in Table 8 we obtain maximum explanatory power of the model and maximum significance of the coefficients when we analyze industrial growth over 7 year periods. This is further evidence for the 5 to 10 years maturity period for dynamic externalities.
| Table 9bDynamic externalities model. Panel data estimation (industry individual effects)Dependent Variable: Employment growth in province-industry in x years time (1) | ||||||
| x=10 (5 periods) | x=7 (8 periods) | x=5 (10 periods) | ||||
| Fixed effects | Random effects | Fixed effects | Random effects | Fixed effects | Random effects | |
| Intercept | -- | -0.11(2.46) | -- | -0.01(0.50) | -- | -0.05(1.79) |
| Employment growth outside the province-industry | 0.42(6.02) | 0.61(10.87) | 0.80(23.78) | 0.83(26.09) | 0.82(27.51) | 0.84(29.29) |
| Employment in the province-industry in the base year (mill.) | -3.56(2.13) | -4.08(2.48) | -2.60(1.91) | -3.06(2.28) | -1.90(1.59) | -2.19(1.87) |
| Wage in the province-industry in the base year (in mills. pts. 1978) | 0.18(2.95) | 0.16(2.98) | 0.10(2.27) | 0.09(2.43) | 0.13(3.58) | 0.10(3.32) |
| Specialization in the base year | -0.019(4.88) | -0.017(4.64) | -0.016(5.58) | -0.014(5.06) | -0.012(5.14) | -0.010(4.68) |
| Competition in the base year | 0.05(14.71) | 0.04(15.11) | 0.04(17.80) | 0.04(18.58) | 0.03(17.64) | 0.03(18.08) |
| Diversity in the base year | -0.75(4.46) | -0.75(4.49) | -0.85(6.62) | -0.85(6.64) | -0.56(5.18) | -0.55(5.13) |
| Adjusted $R^2$ | 0.18 | 0.17 | 0.19 | 0.19 | 0.15 | 0.15 |
| n. obs. | 4368 | 4368 | 6992 | 6992 | 8767 | 8767 |
| d.o.f. | value | d.o.f. | value | d.o.f. | value | |
| F test. $H_0$ : equality of individual effects | (29,4332) | 4.80 | (29,6956) | 4.24 | (29,8731) | 3.45 |
| Hausman test. $H_0$ : ind. of i. effects | (6) | 27.64 | (6) | 18.39 | (6) | 22.46 |
| (1) Log (Employment in t / Employment in t-x). | ||||||
4.3. Static externalities: localization and urbanization
Localization externalities
Independently of whether specialization plays or not a role in industrial growth, it is a pervasive characteristic of industrialization. For instance, for all the territories considered in this study the two biggest industries have an employment share at least twice as big the corresponding national average with shares four to five times bigger that average happening very often.
Glaeser et al (1992) interpret their evidence on the non existence of dynamic externalities due to specialization together with the presence of specialization itself (as our own results also indicate) as evidence of certain past factors determining specialization even if not determining growth at present. They name these factors static localization externalities. This is not however a satisfactory conclusion.
Arguments in favour of the existence of static localization externalities are of three types: a) specialized input markets or natural resources not mobile, b) specialized output markets with volatile demand for firms but not for industries so that employment may be adjusted between neighbouring firms at low cost and c) industries where firms can exert monopsony power in the hiring of factors, specially labour.
To contrast the above hypothesis is not simple due to lack of appropriate data, however hypothesis c) can be tested using labour cost data after controlling for non observable characteristics and by the fact that wages in populated territories embody higher urban premiums. We have adopted the following specification:
\[\frac {W _ {i j t}}{W _ {i t}} = a + b s _ {i j t} + c U R B _ {j t}\tag{11}\]
where is the average labour cost in industry-province ij and year t and is the equivalent nation-wide labour cost, is the specialization index and is a share of urban population in province j. If b is negative, specialization in industry-province ij is helping to keep relative labour costs low. This would be an indirect confirmation of hypothesis c) above. Additionally it can be tested the hypothesis of a positive urban wage premium as predicted by some models of local labour market. It is not our intention however to test these models here as (11) is not an expression fitted to the complexity of local labour markets.
The results of the estimation of (11) are offered in Table 10. Against OLS estimation, a random effects model seems appropriate that improves the estimation and confirms the lack of evidence favourable to the hypothesis c) above of static localization externalities for the sample and period considered and, at the same time, provides evidence of higher than average labour costs for industries located in highly populated or highly urbanized territories.
| Table 10Static externalities model. Localization externalitiesDependent Variable: $W_{ijt}/W_{it}$ | ||||
| OLS | Random Effects | OLS | Random Effects | |
| Intercept | 0.73(127.74) | 0.71(59.44) | 0.46(39.92) | 0.46(19.66) |
| Specialization | 0.01(7.87) | 0.01(5.24) | 0.01(9.40) | 0.02(5.84) |
| Population (millions) | 0.09(23.92) | 0.09(11.25) | ||
| Urbanization (% of people living in cities over 20.000 inhabitants) | 0.65(32.78) | 0.63(15.51) | ||
| Adjusted R2 | 0.10 | 0.86 | 0.16 | 0.86 |
| n. obs. | 5738 | 5738 | 5738 | 5738 |
| d.o.f. | value | d.o.f. | value | |
| F test. H0: equality of individual effects | (1095,4640) | 38.40 | (1095,4640) | 35.30 |
| Hausman test. H0: ind. of i. effects Chisq (d.o.f.) | (2) | 7.19 | (2) | 9.15 |
Urbanization externalities
Some theories argue that firms locate in a territory where local demand is high in order to minimize transport costs. We have named before the diversity of economic activities or industries as urbanization so that we can test what favours urbanization with the following simple expression:
\[v _ {j t} = a + b P O P _ {j t} + c U R B _ {j t}\tag{12}\]
where diversity, is a function of both the population, or size of the territory, and the urbanization rate. The urbanization rate is defined as before. Expression (12) has been estimated by OLS and by a random effects model. Results are offered in Table 11. Both population size and urbanization, solely or jointly, seem to favour diversity of economic activities as measured by our index .
| Table 11Urbanization model.Dependent variable: Industrial diversity, $v_{jt}$ . | ||||||
| OLS | Random effects | OLS | Random effects | OLS | Random effects | |
| Intercept | 0.13(44.39) | 0.13(19.31) | 0.15(24.10) | 0.16(11.25) | 0.15(22.11) | 0.15(10.78) |
| Population million | -0.02(7.14) | -0.02(3.01) | -0.01(4.21) | -0.01(1.46) | ||
| Urbanization (over 20.000 inhabitants) | -0.07(6.13) | -0.08(3.12) | -0.04(2.39) | -0.05(1.75) | ||
| $R^2$ adj. | 0.14 | 0.85 | 0.11 | 0.85 | 0.16 | 0.85 |
| n. obs. | 300 | 300 | 300 | 300 | 300 | 300 |
| d.o.f. | value | d.o.f. | value | d.o.f. | value | |
| F test. $H_0$ : equality of i. ef. | (29,249) | 36.37 | (49,249) | 38.50 | (49,249) | 36.01 |
| Hausman test. $H_0$ : ind. of i. ef. | (1) | 1,40 | (1) | 0,85 | (2) | 2,84 |
On the other hand, the urbanization of a territory can be a consequence of the presence of a higher demand or higher salaries but it can happen that the growth of the top industries deters small industries from the city as a consequence of increasing salaries and rents. Glaeser et al (1992) have tested this hypothesis with a model in which the growth outside the biggest industries depends on the growth of these top industries. We apply this model to our data controlling also for initial wages and employment outside the biggest industries:
\[\log \left(\frac {\sum_ {i + k} L _ {i , j , f}}{\sum_ {i + k} L _ {i , j , 0}}\right) = a + b _ {1} \sum_ {i + k} L _ {i, j, 0} + b _ {2} W _ {\forall i + k, j, 0} + b _ {3} \left(\frac {\sum_ {\forall k} L _ {k , j , f}}{\sum_ {\forall k} L _ {k , j , 0}}\right); K = n \text { top industries }\tag{13}\]
Estimation has been performed by OLS and a fixed effects model accepted by the data. Results are contained in Table 12. They suggest that there is likely to be crowding-in between large and small industries irrespective of the time period along which we explore this relationship. With different data we have also found evidence of crowding-in between industrial and service activities (Goicolea, Herce and de Lucio (1995)). Both these results show the pervasive nature of inter-industry relationships as modelled, for instance, by the Input/Output methodology.
| Table 12Urbanization model.Dependent variable: Log(Employment growth in the province outside six biggest industries, in x years time) | ||||
| Fixed Effects | OLS | |||
| 10 years | 7 years | 5 years | 14 years | |
| Intercept | - | - | - | -0.48(1.8) |
| Employment growth in the province in the six biggest industries. In x years time | 1.23(7.81) | 0.95(9.77) | 1.08(13.36) | 1.07(3.7) |
| Employment in the province outside six biggest industries. Initial year. (in millions) | -8.77(1.72) | -10.82(2.85) | -7.80(2.36) | 0.50(0.4) |
| Wage in the province outside six biggest industries. Initial year. (in mills. pts. 1978) | -1.13(3.14) | -1.49(4.69) | -0.89(3.35) | -0.86(2.3) |
| $R^2$ adj. | 0.41 | 0.36 | 0.40 | 0.27 |
| n. obs. | 250 | 400 | 500 | 50 |
| Hausman test. $H_0$ : ind. of i. effects (d.o.f) | 14.52 (3) | 18.21 (3) | 21.34 (3) | |
5. Concluding comments
We have attempted in this paper to test for the presence of a variety of externalities that may influence the configuration and growth of economic activity in the territory, more precisely industrial employment growth. Our methodology has followed closely that of Glaeser et al. (1992) although we present additional panel data estimations. We have moreover tried to establish a clear typology of these external effects identifying the scatter definitions offered in the literature.
The empirical analysis has been made using data from the Spanish Industry Survey from 1978 to 1992 for 30 manufacturing branches. The evidence presented in the paper suggest that there are static urbanization economies, we also obtain evidence of manufacturing crowding-in between the biggest industries in each territory and the rest. On the contrary we fail to capture any static localization economies. Concerning dynamic externalities, favouring the growth of economic activity, we confirm the presence of diversity (Jacobs) and competition (Porter) economies. We find no evidence of dynamic economies of specialization (MAR), on the contrary, our results suggests that specialization may favour industrial decline at present. According to these results technological spillovers take place mainly through cross fertilization between industries stemming out of their diversity. These findings are similar to the ones obtained by Glaeser et al. However, after controlling for individual effects, we obtain mixed evidence for diversity externalities.
References
Arrow, K. J. (1962): "The Economic Implications of Learning by Doing". Review of Economic Studies n° 29 pp. 155-173.
Glaeser, E. L.; Kallal, H. D.; Scheinkman, J. A. and Shleifer, A. (1992): "Growth in Cities". Journal of Political Economy. Vol 100, n° 6.
Goicolea, A., J. A. Herce and J. J. de Lucio: "Patrones Territoriales de Crecimiento Industrial en España". Documento de Trabajo 95.14 FEDEA
Henderson, V.; Kuncoro, A.; Turner, M. (1995): "Industrial Development in Cities". Journal of Political Economy. Vol 103, n° 5, pp. 1067-1090.
Henderson, V.J. (1992) "Where Does an Industry Locate?" Journal of Urban Economics, n° 35, pp. 83-104.
Henderson, V.J. (1994) "Externalities and Industrial Development" NBER Working paper series. n.4730. Massachusetts.
Jacobs. J. (1969): The Economy of Cities. New York Vintage.
Krugman, P. (1991): Geography and Trade. Cambridge, Massachusetts: MIT Press.
Livas, R. and Krugman, P. (1992): "Trade Policy and The Third World Metropolis". National Bureau of Economic Research. Working Paper n° 4238
Maillat, D., Nemeti, F. and Pfister, M. (1995) "Distrito Tecnológico e Innovación. El Caso del Jura Suizo" in Desarrollo Económico Local en Europa. eds. Vázquez Barquero, A. and Garofoli, G.
- Marshall, A. (1890): Principles of Economics. London, Macmillan.
- Porter, M.E. (1990): The Competitive Advantage of Nations. New York. Free Press.
- Romer, P. M. (1986): "Increasing Returns and Long-Run Growth". Journal of Political Economy. Vol 94, pp. 1002-1037.
Saxenian, A.L. (1994). Regional Advantage. Culture and Competition, Silicon Valley and Route 128. Harvard University Press: Cambridge and London.
- Storpper, M. and Christopherson, S. (1987): "Flexible Specialization and Regional Industrial Agglomerations: The Case of the U.S. Motion Picture Industry". Annals of the Association of American Geographers, n° 77, pp. 104-117.
Vázquez Barquero, A. and Sáez Cala, A. (1995). "La Dinámica de los Sistemas Productivos Locales. El Caso de la Industria del Calzado en España" in Desarrollo Económico Local en Europa. eds. Vázquez Barquero, A. and Garofoli, G.
COLECCION RESUMENES
96-01: "El mercado de depósitos español (1985-1994): Bancos versus Cajas de Ahorro", Juan Coello.
TEXTOS EXPRESS
96-01: "La Seguridad Social del siglo XXI y la reforma de las pensiones de 1996", José A. Herce.
95-02: "La reforma de las pensiones: Una encuesta rápida entre los analistas del sistema español", Coordinada por José A. Herce y Victor Pérez Díaz.
95-01: "Los problemas de la Sanidad en España: Una encuesta rápida entre los expertos en economía de la salud", Coordinada por José A. Herce, Juan Cabasés y Guillem López i Casasnovas.
DOCUMENTOS DE TRABAJO
96-14: "Externalities and industrial growth: Spain 1978-1992", Juan J. de Lucio, José A. Herce y Ana Goicolea.
96-13: "Bases para profesionalizar la sanidad pública", Benito Arruñada.
96-12: "Capacity utilization and market power", J-Fr. Fagnart, Omar Licandro y H. R. Sneessens.
96-11: "Idiosyncratic uncertainty, capacity utilization and the business cycle", Frank Portier, Omar Licandro, y Jean François Fagnart.
96-10: "La financiación privada de los servicios sanitarios", C. Murillo, S. Calonge e Y. González.
96-09: "Los efectos visibles de la reforma laboral de 1994", Juan F. Jimeno.
96-08: "Diseño y evaluación de estrategias de desregulación en el sector sanitario público en España", Juan Manuel Cabasés Hita y José Martín Martín.
96-07: "Efectos de políticas macroeconómicas en una unión monetaria con distintos grados de rigidez salarial", Carlos de Miguel Palacios y Simón Sosvilla-Rivero.
96-06: "Environmental consequences of the Community Support Framework 1994-1999: Energy consumption and associated emissions in Spain. A HERMIN-model based evaluation", Vicente Antón, Andrés de Bustos, José A. Herce y Simón Sosvilla-Rivero
96-05: "El paro en España: Una encuesta a estudiosos del mercado de trabajo", Sonsoles Castillo, Rosa Duce y Juan F. Jimeno.
96-04: "Los sistemas mixtos de retribución como alternativa al pago por salario y su repercusión sobre la eficiencia del sistema sanitario", Marisol Rodríguez, Diego Rodríguez e Ignacio Abásolo.
96-03: "La creación de un mercado de medicamentos genéricos en España", Félix Lobo.
96-02: "La acreditación de hospitales: Un paso hacia la liberalización del mercado hospitalario español", Lluís Bohigas.
96-01: "La persistencia del paro: Economía y factores institucionales", Juan F. Jimeno.
95-26: "El crecimiento económico en España, 1964-1993: Algunas regularidades empíricas", Oscar Bajo y Simón Sosvilla-Rivero.
95-25: "Análisis de modelos alternativos de retribución de las oficinas de Farmacia", Ramón Gisbert, Joan Rovira y Rafael Illa.
95-24: "Teoría de los ciclos reales y fluctuaciones agregadas de la economía española", Luis A. Puch y Omar Licandro.
95-23: "La financiación hospitalaria basada en la actividad en sistemas sanitarios públicos, resulación de tarifas y eficiencia: El caso de la concertación hospitalaria en Cataluña", Guillem López i Casasnovas y Adam R. Wagstaff.
95-22: "Differential-difference equations in economics: On the numerical solution of vintage capital growth models", Raouf Boucekkine, Omar Licandro y Christopher Paul.
95-21: "Utilización del capital y ciclo económico español", Omar Licandro, Luis A. Puch y Ramón Ruiz-Tamarit.
Este texto se ha extraído automáticamente del documento original. Para citarlo o leerlo con su maquetación, descargue el PDF.
Descargar en PDF