Capacity and access pricing strategies: An argument for the liberalization of telecommunication infrastructure* by
A. Urbano G. Olcina and Y. Tauman
DOCUMENTO DE TRABAJO 96-26
Noviembre, 1996
* We thank Francisco Caballero Sanz for helpful comments and the financial support of the Bank of Spain
** University of Valencia.
*** Institute for Decision Sciences, State University of New York at Stony Brook and Graduate School of Business Administration, Tel Aviv University.
Abstract
This paper analyzes some of the problems that arise when pricing access to network and the size of the network are considered as variables simultaneously determined by the network operator. The resolution of the model shows several possible outcomes in this setting. However none of them is satisfactory from the point of view of competition in the final service market nor in terms of the development of the network. In the case of an efficient monopolist, the capacity choice gives a relatively large network size, but the impact of entry is quite limited as prices for the final services remain high. On the other hand, less efficient incumbents, will restrain the growth of the network and competition will not be very active either. More importantly, the access price will be quite high and this will discourage entry and the development of markets for new services. Our findings provide some theoretical background for the existing empirical evidence.
1. Introduction.
There is a generalized consensus nowadays that the provision of telecommunications services should take place under competitive conditions. Throughout the world, liberalization processes have ended up with the traditional monopolies Public Telecom Operators (PTOs) which have been providing telecommunications services for decades.
The liberalization of telecommunications has sparked a good deal of theoretical work to study competition conditions in markets of final services when there is a common network provided by one network operator and other suppliers of services have to interconnect and use the same network in order to provide the final service. The most significant body of that literature considers the problem of pricing access to the network for competitors or the leasing of lines by the network operator. In the case of liberalized infrastructures, the problem arises when different operators have to interconnect their networks, offering interoperable networks to other companies user them to provide final services.
That strand of the literature has produced interesting pieces of work with practical implications for the industry such as Baumol and Sidak (1994), Lafont and Tirole (1995) among others.
However, most of this work has not taken into account the impact of access pricing -and other problems that appear when one firm supplies an intermediate input to its competitors downstream-, on the development of the network. The large majority of these theoretical models are essentially static and do not look into the implications of access pricing or interconnection of networks on some dynamic issues such as investment and the rate of growth of the network capacity available for competition in the provision of final services. These dynamic issues are very important as determinants of competition in the supply of telecommunication services. Entry will largely depend on the capacity available and its price. Other questions such as the level of investments carried out by network operators to maintain the networks operational or the quality of the infrastructure made available to competing service providers are also important determinants of competition conditions in practice. Furthermore, decisions on pricing access to networks are not independent from the decisions to carry out the necessary investments to increase the capacity available to competing service providers. Firms' decisions on how to price access to the networks and on network capacity are interdependent. When firms fix access prices, they are indirectly determining the degree of entry by downstream competitors, and therefore, the capacity demanded. On the other hand, when they decide the capacity made available to other service providers, they are determining the maximum output level of final services downstream and therefore, the prices of those services, indirectly, that are linked how much will competitors be willing to pay for access to the network. From the point of view of competition, the issue of capacity availability is as important as the problem of access prices or the existence of non-discriminatory access. If network operators are not ready to carry out the necessary investments to make sufficient capacity available to other service providers, in quantitative terms, there will not be effective competition in the market place. This paper analyzes some of the problems that arise when pricing access to networks and the size of the network are considered as variables simultaneously determined by the network operator. The recent literature on access pricing relies on the idea that incumbent network operator will use access price as a strategic variable to influence competition conditions in the downstream market for final telecommunications services. High access tariffs could deter entry by new competitors. Cross subsidies could help to keep them at bay by lowering the prices of services open to competition to deter entry.
However, this presumed behaviour of traditional operators and network owners is based on the assumption that capacity for new entrants is not a strategic variable for the operator. Little is known about how the optimal strategies open to network operators when they decide at the same time about access prices and the total capacity made available to competitors for instance. In that setting, an alternative strategy to keep potential entrants from becoming effective competitors might be limitly the size of the network to leave them no room to compete. Moreover, we do not know much about the behaviour of the entrants, which is also essential to learn about the performance of the industry. Will they accommodate to the conditions established by the incumbent? Or, will they undercut the incumbent in order to gain market share?
All these questions are extremely important to learn what can be expected in terms of performance in the markets for liberalized services and to better re-regulate those markets. But that is not all. If the behaviour of the network owner and the operator leads to a poor performance in terms of entry and competitive prices in the market for telecommunications services and in terms of the rate of growth of the network -and therefore, the development of the information society-, one could also question the economic rationality of the monopolistic condition of the network operator. If the existence of a single network owner and operator hinders the overall performance of the sector, one would have to question the persistence of a natural monopoly in the telecommunications infrastructure. The social advantages of having just one network would have to be compared with and might offset the social cost derived from the poor market performance resulting from the strategic behaviour of the network owner. If the net effect is negative in terms of social welfare, this might justify the existence of network duplication, which would foster entry and the development of the information society. In that case, the case for natural monopoly in telecommunications infrastructure would be questionable and the liberalization of network infrastructure would be justifiable on economic grounds.
In the following sections we explore these issues. Firstly, we look at the empirical evidence from the European Union and OECD countries. Given that the deregulation of telecommunications services has gone ahead of the liberalization of telecommunications infrastructure we can see how access prices and network expansion have evolved when the network operator has faced competition in the markets for services. Secondly, we set up a game theoretical model that sheds light into the strategic choices open to network operators who have to face competition downstream and decide on access prices and capacity constraints at the same time.
In our model a firm enters a network industry where the incumbent can choose both the access price for the services provided to the new entrant and the capacity of the network. The price of a final service downstream is supplied in competition with a new entrant.
The incumbent network monopolist acts as a leader, accommodating for the entry of the new competitor in order to maximize his own profits if he cannot avoid entry. For simplicity, it is assumed that the network owner and the entrant
produces just one single final service.
The outcome of this setting is not a trivial question. Given that the monopolist has two choice variables, a priori, it is not evident whether he will raise the access price, limit the capacity available to the entrant, or both. Furthermore, the question becomes more interesting if we consider a key element underlined in the OECD study: the relative efficiency of the incumbent and the entrant.
This paper uses the Bertrand-Edgeworth model of price competition to examine the role of access-pricing decisions in deciding capacity precommitments that in turn are used to influence competition in the final service market. We allow firms to have different unit costs of production up to capacity. This enables us to examine the role of differential efficiency in determining the nature of pre-commitment, and to characterize the equilibrium for arbitrary costs of capacity and fixed set-up costs. The distinction between the cost of capacity and the cost of production up to capacity is crucial to the understanding of a wide range of economic phenomena.
The resolution of the model shows several possible outcomes in this setting. However, none of them is satisfactory from the point of view of competition in the final service market nor in terms of the development of the network. In the case of an efficient monopolist, the capacity choice gives a relatively large network size, but the impact of entry is quite limited as prices for the final services remain high. In fact, this type of solution implies a high capacity for the incumbent monopolist and a much smaller capacity for the entrant. Neither firm will operate close to full capacity and the incumbent may provide a stochastic price umbrella under which the entrant can price. This outcome resembles the "Judo" solution of Gelman and Salop (1983). To implement this solution the monopolist may cross-subsidize by charging an internal price for the usage of capacity below marginal cost.
The closest literature to our work is the one dealing with entry deterrence, from the limit pricing model of Bain (1956), Sylos Labini (1969), and Modigliani (1958), to the more recent analysis of Kreps and Scheinkman (1983), Davidson and Deneckere (1986), Deneckere and Kovenock (1989b) and Allen et al. (1995). Our paper shares with the four last analysis the assumption regarding competition in the post-entry game.
On the other hand, if the incumbent is a less efficient firm, it will restrain the growth of the network and competition will not be very active either. More importantly, the access price will be quite high and this will discourage entry and the development of markets for new services. This solution allows the monopolist to remain as provider of final services despite entry and competition in that market. However, this will be a relatively passive type of competition and prices will remain relatively high. With this strategy even a very inefficient monopolist remains active in the final service market. In that case, its capacity and output will be quite small, but the entrant will not be able to price him out of the market.
The next section looks at the empirical evidence for the European Union and OECD countries. It indicates that monopoly PTO's maintain high prices and limited availability of network capacity. In the remaining of the paper we present a theoretical model that tries to explain the empirical findings. Some conclusions follow.
2. The recent experience after the deregulation of telecommunications services.
The European experience in the process of liberalization is quite illustrative of the response by the traditional monopolistic PTOs to the new competitive environment the provision in services when infrastructures remain under the control of a simple operator.
After the progressive liberalization of different telecommunications services, it was considered that competition in the newly liberalized markets could be ensured by the joint application of standard competition rules and the so-called "Open Network Provision" directives. The Open Network Provision directives of the EC were introduced in 1992, before the review of the liberalization of telecommunications. Those directives did not question the monopolistic provision of infrastructures. They established that the network operator should facilitate access to competing service providers under non-discriminatory conditions. For instance, directive 92/44/EEC requires that leased lines be offered on a cost-oriented basis. The "natural monopoly" arguments for the minimization of the social costs for the provision of telecommunications infrastructure were not challenged at that time. It was assumed that the opening of services to competition could be ensured by the application of the ONP directives and an effective enforcement of Directive 90/388/EC for the application of competition to the telecommunications markets.
From a legal and economic perspective, this was considered an optimal solution. On one hand, a single network to be shared by all service providers would ensure a minimum social cost and avoid "wasteful duplications of infrastructure". On the other hand, competition rules could assure that prices of final services to consumers would be kept down. ONP directives and the application of article 86 of the Treaty would take care of market conditions in the intermediate market for leased lines. Basically, it was considered that as long as there were no discriminatory access conditions and access prices were not abusive, overall market performance would be satisfactory.
With some local differences, the logic of this market arrangements was based on the anglosaxon legal doctrine of "essential facilities" and its economic counterpart, Third Party Access. A development of Antitrust practice, the essential facilities doctrine has been at the origin of a common approach in the regulation of different public utilities such as gas, telecommunications, electricity and railways, where free and non-discriminatory access to networks was essential to ensure competition.
However, the logic of TPA and ONP underestimates, in our opinion, the potential impact of the strategic behaviour of the network operator. Recent empirical evidence from the EU and the OECD tends to support our point of view.
In the Green Paper for the liberalization of telecommunications infrastructure, the Commission published data about the conditions prevailing in the markets for telecommunications leased lines in European countries. Table 1 below reproduces data from the first part of the Green Book showing how rental prices for leased lines diverged considerably between Europe and the USA in a ten to one proportion. Within the EU, prices of leased lines were significantly higher in those countries with liberalized infrastructure like the UK and those maintaining a monopoly in that industry segment.
[Insert table 1 here]
But the performance of monopolized networks did not differ just in terms of access prices. One of the main argument presented by the Commission for the liberalization of infrastructure was the lack of availability of the basic infrastructure over which liberalized services are operated to third parties. High prices and limited availability of network capacity were considered responsible for the delays in "the widespread development of high speed corporate networks in Europe, remote accessing of databases by both business and residential users and the development of innovative services (such as telebanking, distance learning, etc..)".
These views had already been expressed in the report on "Europe and the global Information Society". A high level group chaired by Commissioner Bange-mann recommended to "accelerate the on-going process of liberalization of the telecoms sector by opening-up to competition infrastructure and services still in the monopoly area; removing non-commercial political burdens and budgetary constraints on telecommunications operators, and setting clear timetables and deadlines for the implementation of practical measures to achieve those goals".
Further empirical evidence about the unsatisfactory performance of monopolized telecommunications infrastructure markets has been recently provided by the OECD. Taking the market for the provision of Internet services, the OECD working party on telecommunications and information services policies has been able to provide evidence on the market performance in OECD countries. This interesting study shows that the average price for leased line access to the Internet in countries with monopoly telecommunications infrastructure provision is 44% more expensive than in countries with competitive provision of infrastructure. These conditions in the intermediate service market are reflected in the prices for final services. On average, Internet Access Provider's prices for dial-up services are nearly three times less expensive in countries with telecommunications infrastructure competition than those with monopoly markets. For a basket of 30 hours per month of dial-up Internet access (i.e. public switched telecommunication networks plus Internet Provider charges) seven of the eight countries with infrastructure competition are below the OECD average while 12 of the 17 countries without infrastructure competition are above the OECD average.
\[[ I n s e r t \quad t a b l e \quad 2 \quad h e r e ]\]
The OECD study gives also interesting information related to another aspect of the performance of the market for access to networks. They indicate that there is a danger that monopoly PTOs, by maintaining high underlying charges for capacity, could restrict the growth of dial-up and leased line Internet access services until they are ready to enter the market or because they view some new Internet services as threats to traditional sources of revenue.
3. The theoretical model.
Consider two firms, an incumbent monopolist (firm 1), which produces two goods x and y, and an entrant (firm 2), which produces good y. Firms compete in prices (i = 1, 2), in the market for (the homogeneous) good y, and face capacity constraints and respectively.
Each firm may produce up to capacity at the unit cost of . Thus, if firm sales at the price-setting stage are , its variable cost of production is equal to
\[c _ {i} (q _ {i}) = c _ {i} q _ {i} \quad \text { for } q _ {i} \leq k _ {i}, \quad i = 1, 2\]
Output greater than a firm's capacity is assume to be infinitely costly.
In order to get closed form solutions for the equilibrium in the price-setting subgames, we assume that aggregate market demand is linear.
Let
or
\[p \equiv P (q _ {1} + q _ {2}) \equiv M a x (1 - q _ {1} - q _ {2}, 0)\]
Because capacity constraint limit the amount of output that can be supplied, firms may have to ration customers at the prices they select. Following Kreps and Scheinkman (1983), we assume that demand is rationed efficiently: if , then firm i sells and firm j faces a residual demand equal to . When firms set identical prices, we assume that all demand first flows to the low-cost firm and that the high-cost firm serves any residual demand. To break ties when we arbitrarily let firm 1 sell its capacity first.
Capacity levels are not exogenous, but firms choose them before price competition. To build up any capacity level, the entrant has to incur in both a lump-sum fixed set-up cost, that can be avoided only if zero capacity is installed, and a constant per unit cost of capacity. The capacity cost for the incumbent monopolist are, however, different.
The incumbent produces two goods . To produce x it needs to incur the fixed set-up costs . However, once has been spent, to produce y, only needs the variable cost . Let be the cost of capacity for firm 1, then
\[\rho_ {1} (k _ {1}) = \left\{ \begin{array}{l l} & r _ {1} k _ {1} \quad \text { if } k _ {1} > 0 \\ & 0 \quad \text { if } k _ {1} = 0 \end{array} \right.\]
We assume that the fixed set-up costs needed for the entrant to build up any capacity per good y are so big that it is not profitable for him to install any capacity, so that if he wants to produce good y he has to buy the capacity' services from the monopolist and to pay an access price for it . Hence, the incumbent is the only firm which may build up the industry capacity and may sell part of it to the entrant at some access price , where is the variable cost.
We also assume that the incumbent is constrained by the Regulatory Agency, so that it cannot refuse to sell capacity to the entrant. Since the incumbent has to decide the industry capacity in advance, we assume that the choice of capacities is sequential, and hence, the entrant is a capacity follower. In this context, the problem of the incumbent is to choose both an access price and an industry capacity, such that it can get its most preferred outcome in the price game.
We model our problem as a three stage game:
1. In the first stage, the incumbent chooses both a price for the entrant capacity, a pair , and a capacity , knowing that the entrant is a capacity follower. Notice that to choose and to sell to firm 2, is similar to choose a for the industry.
2. In the second stage, the entrant, having observed the incumbent capacity level and knowing the access price, chooses .
3. Finally, in the third stage, both firms compete in prices.
We assume that the monopolist is able to build up any .
We will characterize, next, the equilibria in the market competition. In the analysis that follows we rule out strategies in which firms price below their unit cost of production
Think of connection to the monopolist's network infrastructure.
Finishing our work we got to know of the work of Allen et al. (1995) that deals with sequential capacity choice and entry deterrence. We have unified our notation with theirs.
4. The Price-Setting Subgames (third stage)
The equilibria (in prices) for the final product market is characterized by three regions of capacity with qualitatively distinct simultaneous-move equilibrium.
Recall that or
\[p \equiv P (q _ {1} + q _ {2}) \equiv M a x (1 - q _ {1} - q _ {2}, 0)\]
and that , and demand is rationed efficiently.
If , sells and the residual demand of is .
Profits are then, given the constant marginal cost , .
\[\Pi_ {i} (P _ {i}, P _ {j} | k _ {i}, k _ {j}) = \left\{ \begin{array}{l l} L _ {i} (P _ {i}) \equiv (P _ {i} - c _ {i}) \min (k _ {i}, d (P _ {i})) \text {if} P _ {i} < P _ {j} \\ T _ {i} (P _ {i}) \equiv (P _ {i} - c _ {i}) \min (k _ {i}, \max (0, d (P _ {i}) - I _ {h} ^ {i} k _ {j}) \text {if} P _ {i} = P _ {j} \\ H _ {i} (P _ {i}) \equiv (P _ {i} - c _ {i}) \min (k _ {i}, \max (0, d (P _ {i}) - k _ {j}) \text {if} P _ {i} > P _ {j} \end{array} \right.\]
\[\begin{array}{r l} \text {where} I _ {h} ^ {i} = 1 & \text {if} c _ {i} > c _ {j}, \text {or} c _ {1} = c _ {2}, i = 2 \\ & = 0 \text {if} c _ {i} < c _ {j}, \text {or} c _ {1} = c _ {2}, i = 1 \end{array}\]
Let be the inverse demand function and let
\[\begin{array}{r l} Q _ {i} ^ {c} (k _ {j}) & = A r g \max _ {q} \left\{\left[ p (q + k _ {j}) - c _ {i} \right] q \right\} \\ & = \max \left\{0, \frac {1}{2} (1 - k _ {j} - c _ {i}) \right\} \end{array}\]
be the best-response function corresponding to the cost function .
We derive next the Nash equilibria in the price-setting subgame .
For a more complete treatment see Deneckere and Kovenock (1989a,b), and Allen et al. (1995), which show that, except in cases where the high-cost firm makes zero profits, equilibrium strategies are uniquely determined.
To describe equilibrium profits note that, for some ranges of costs and quantities, equilibrium exists in pure strategies, while in other regions, equilibrium requires non-degenerate mixed strategies.
It is easy to prove the following results.
Lemma 1. In a pure strategy equilibrium, . Firms sell up to capacity and,
Lemma 2. In a pure strategy equilibrium, firm i never charges less than in the capacity constrained price-game. That is, there is no point charging a (low) price that leads to the firms to produce beyond the optimal reaction to the other firm's capacity (if it can do so).
From lemmata 1 and 2 we conclude that a pure-strategy equilibrium exists only if, for all , .
Profits are then: ,
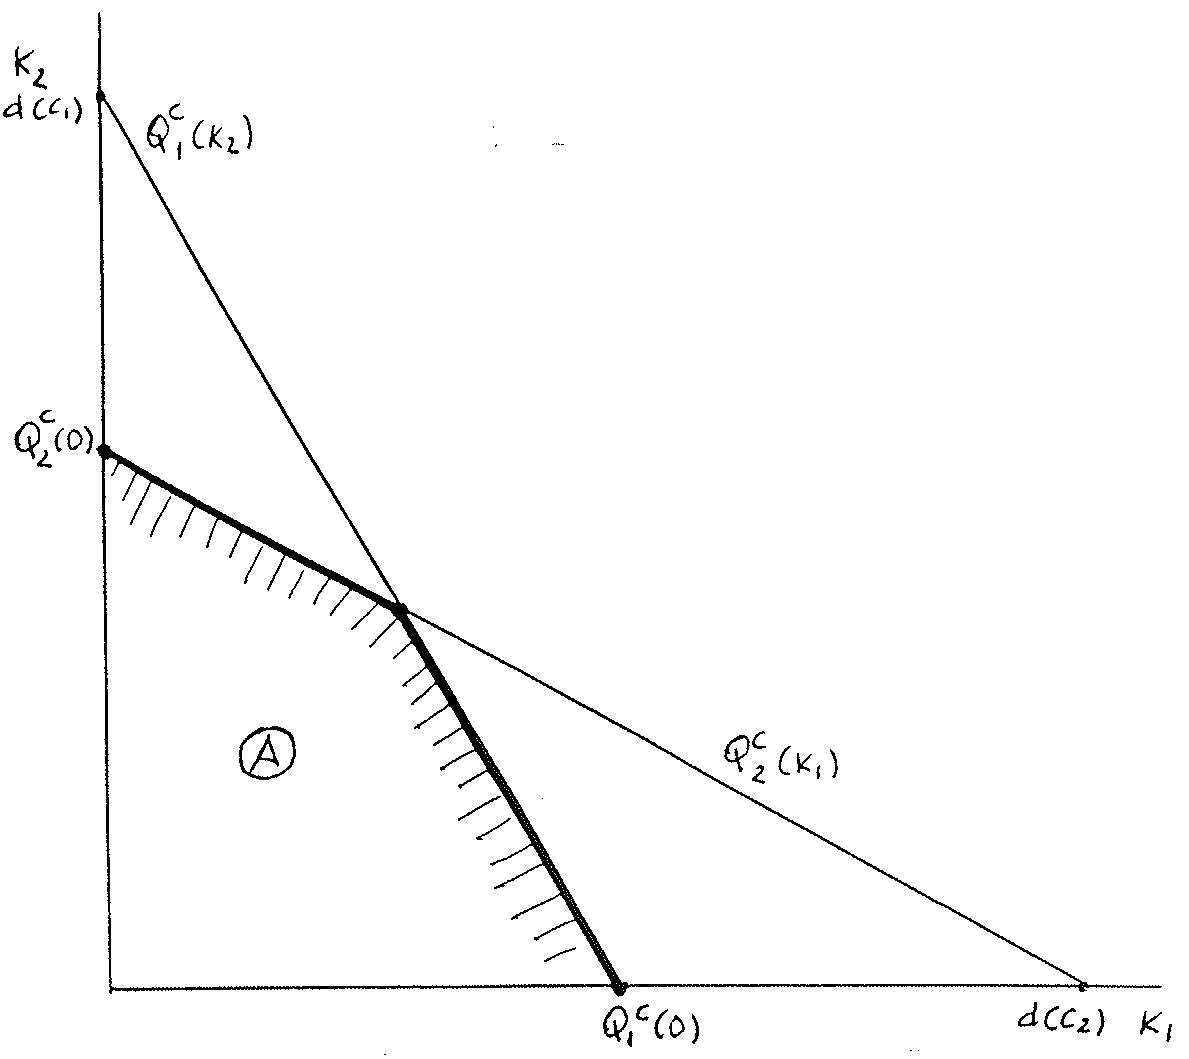
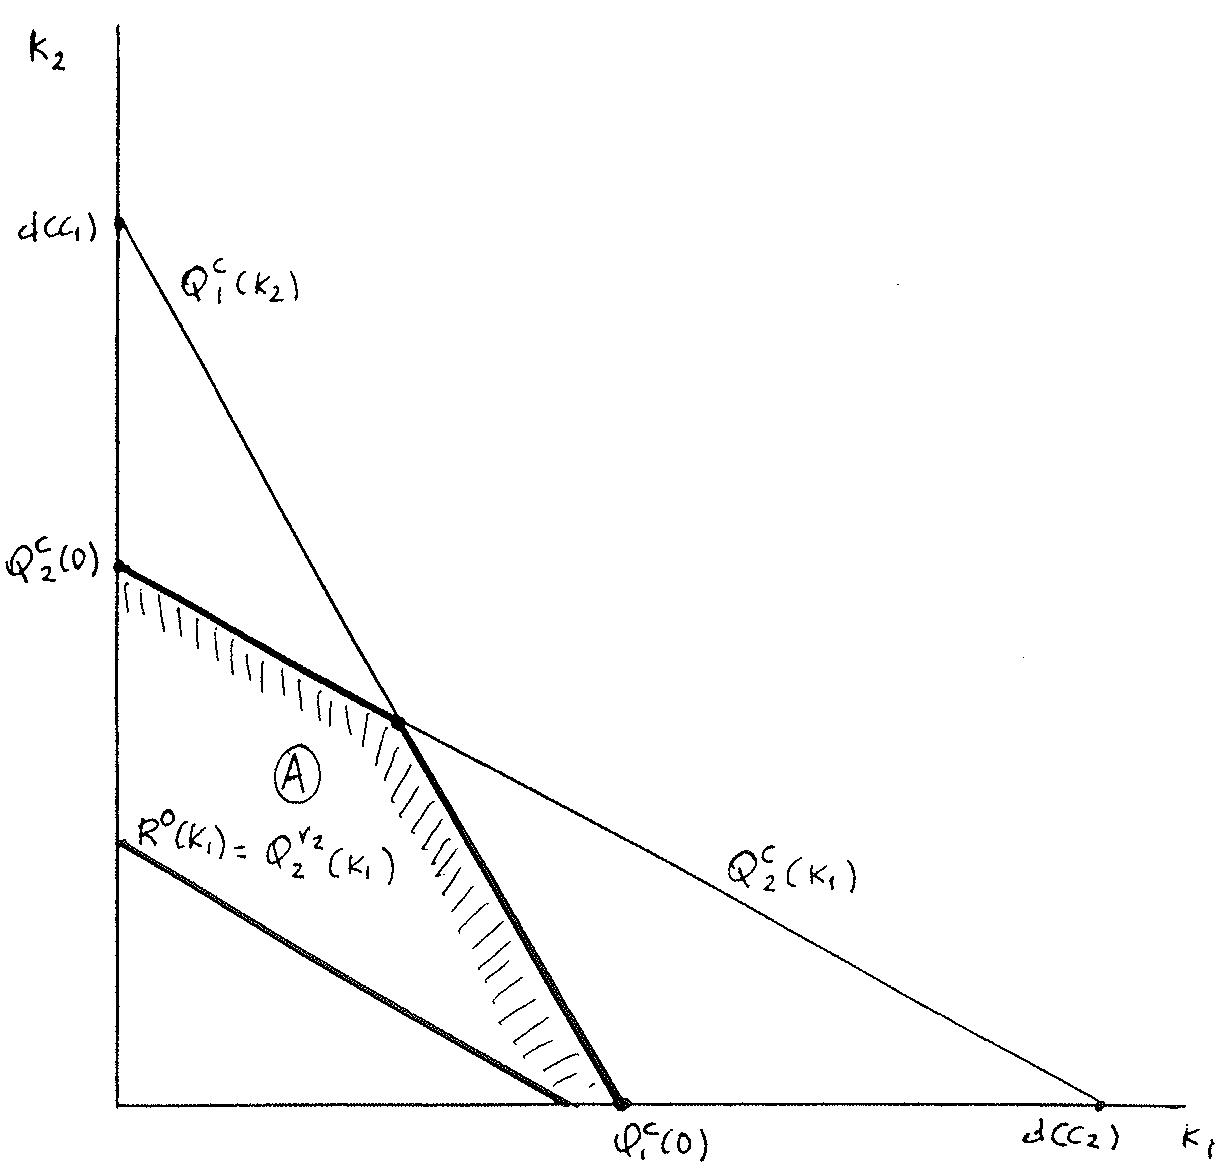
Let us call , the region of pure-strategy equilibrium
(Insert Figure 1)
Above either reaction curve, the only possible equilibrium is a "mixed-strategy" one.
A mixed strategy for firm is a cumulative distribution of prices for
We state without proof the following result.
Lemma 3. In the mixed strategy region , for at least some firm , each firm can always guarantee to itself its minimax profits, and if the firm is not capacity constrained it can always guarantee to itself its "Stackelberg follower profit":
\[\Pi_ {i} ^ {*} = Q _ {i} ^ {C} (k _ {j}) [ P (k _ {j} + Q _ {i} ^ {C} (k _ {j})) - c _ {i} ] = Q _ {i} ^ {C} (k _ {j}) [ (1 - k _ {j} - Q _ {i} ^ {C} (k _ {j})) - c _ {i} ]\]
Let us call B, the region of mixed-strategy equilibrium.
Let
\[H _ {i} ^ {*} (P _ {i}) = \operatorname{Min} \left[ \frac {1 - k _ {j} - c _ {i}}{2}, k _ {i} \right] \left\{\operatorname{Max} \left[ \frac {1 - k _ {j} + c _ {i}}{2}, 1 - k _ {i} - k _ {j}, c _ {i} \right] - c _ {i} \right\}\]
be the minimax profit of i, and let
\[\underline {{{P}}} _ {i} \equiv \min \{P: L _ {i} (P) = H _ {i} ^ {*} \}\]
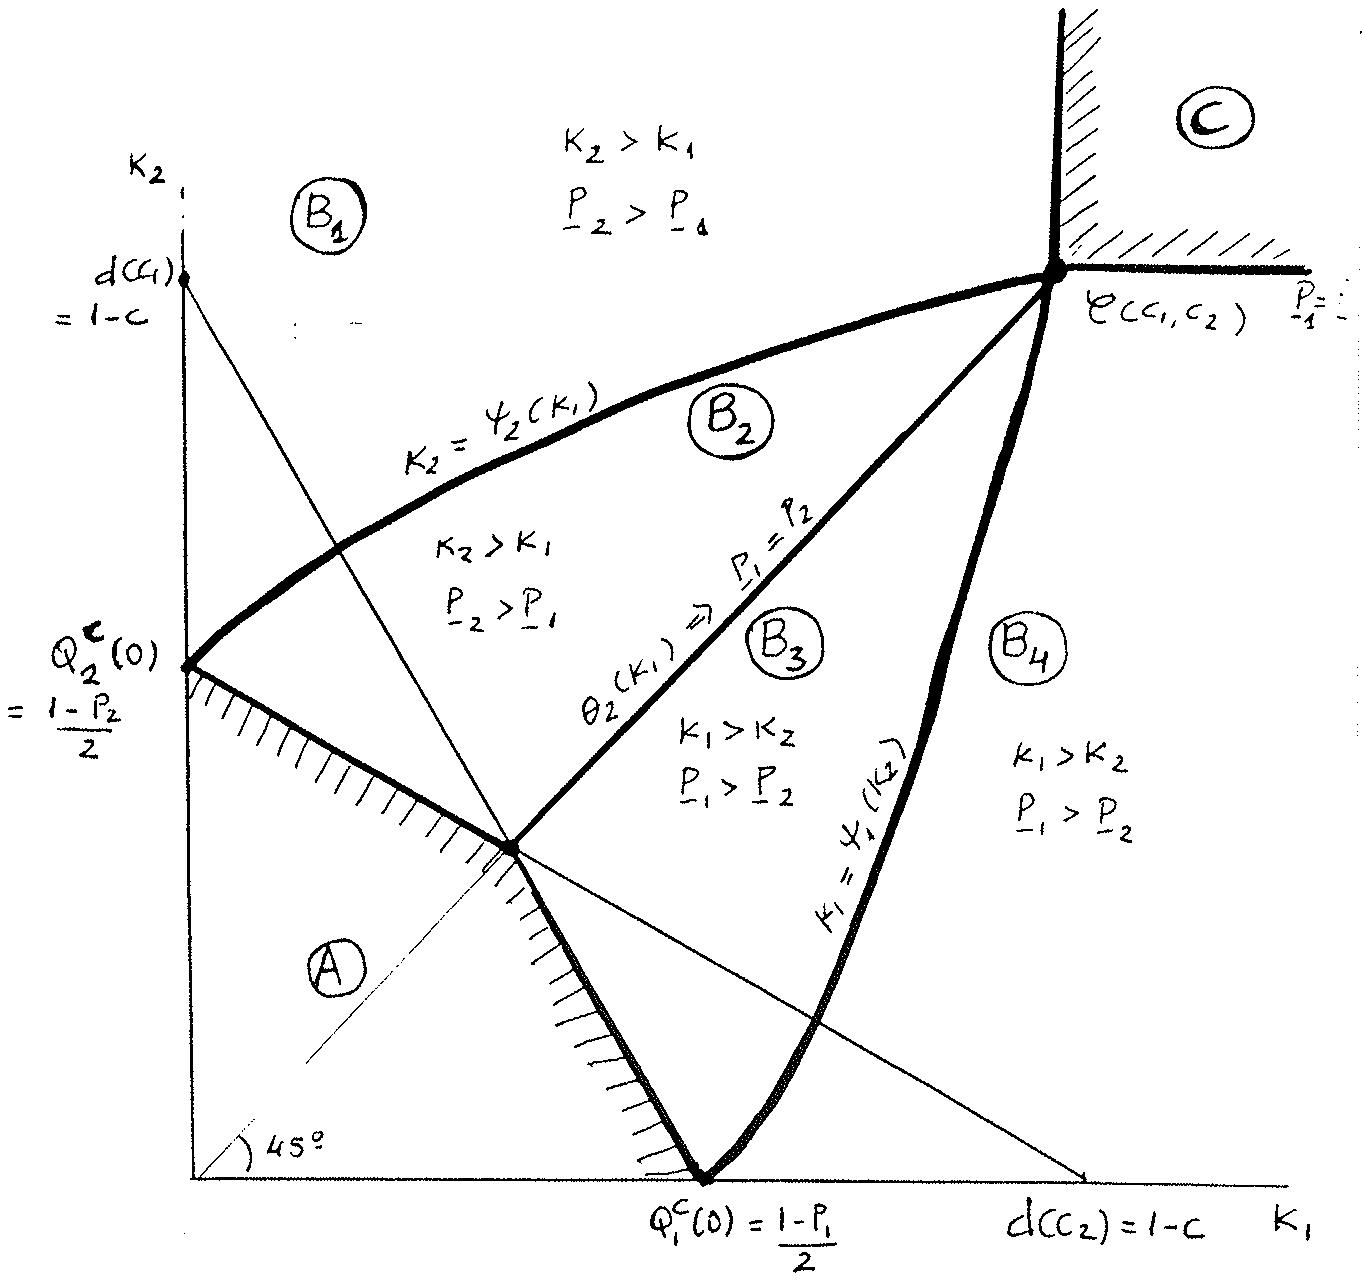
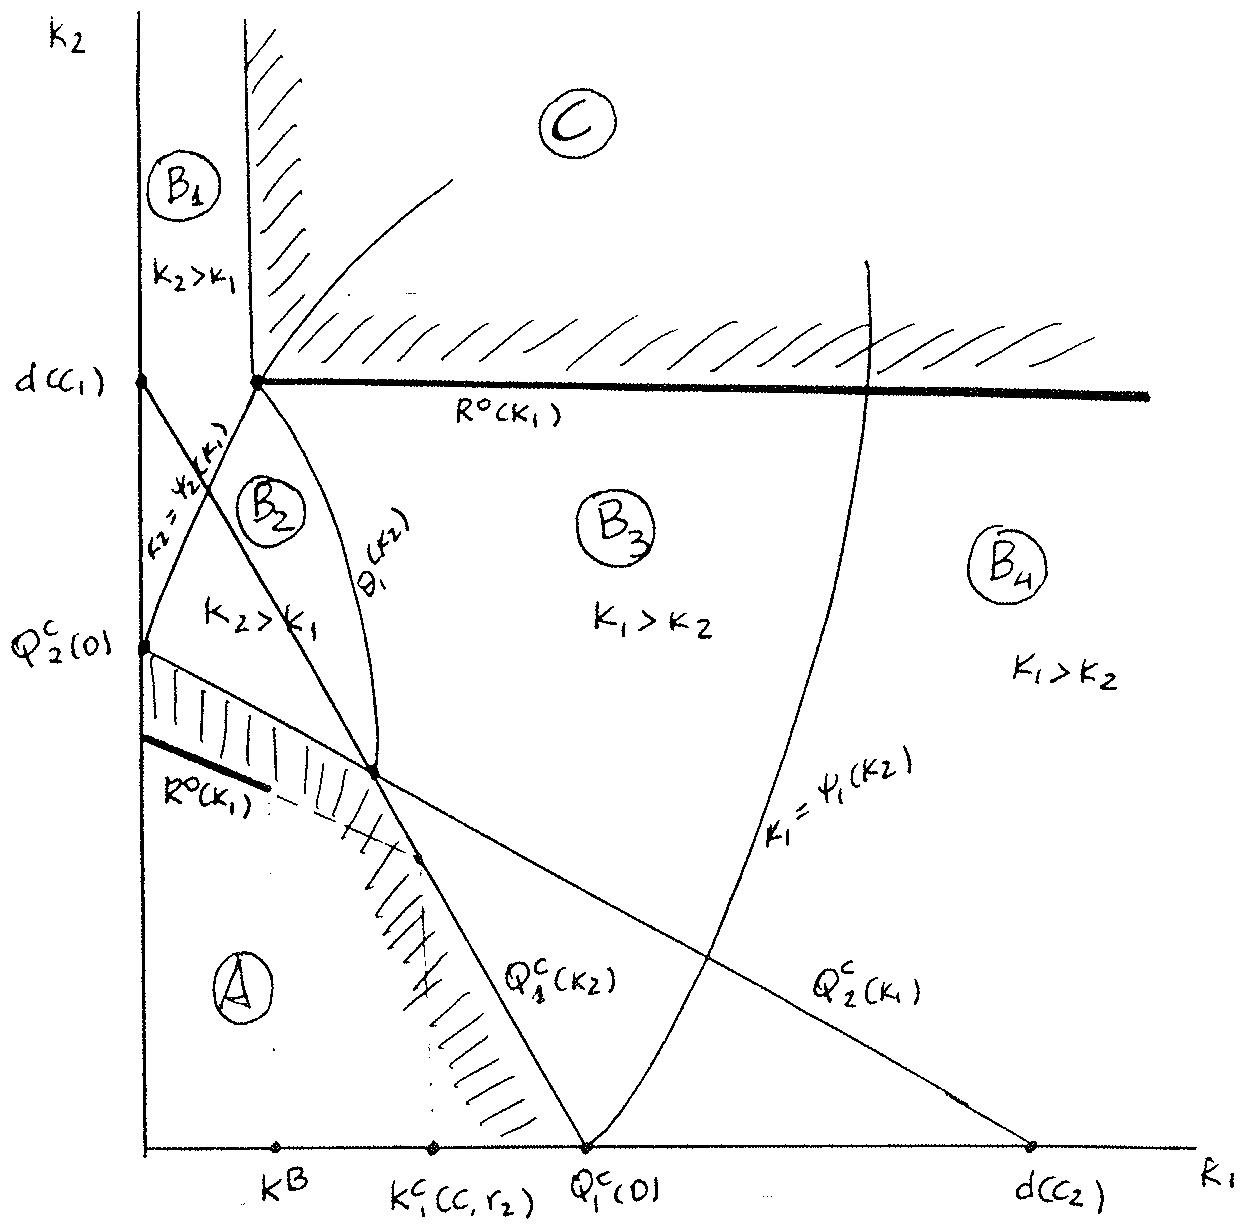
The interpretation of the above analysis is as follows: Suppose first that the firms have the same production costs. First, if both firms have enough capacity to serve the entire market, then the (common) equilibrium price (in pure strategies) is equal to the (common) marginal cost and we obtain the standard Bertrand result (region C). Second, consider the region below both firms' Cournot reaction functions. Over this region (region A) quantity competition and price competition coincide since each firm can sell at full capacity, and the equilibrium price (in pure strategies) is such that it clears up the industry capacity, i.e.: . Finally, we have region B, of the Edgeworth-cycle, where no pure-strategy equilibrium in price exists. Our assumptions on demand nevertheless guarantee the existence of a unique mixed strategy equilibrium in which firms randomize over a common interval. The upper endpoint of this interval must be , the monopoly price of the residual demand curve of the large firm, say . To see this, note that one of the firms must be undercut with certainty at the upper endpoint of the support, so that it has to be one of the . If , then and we are done. So suppose that , and let
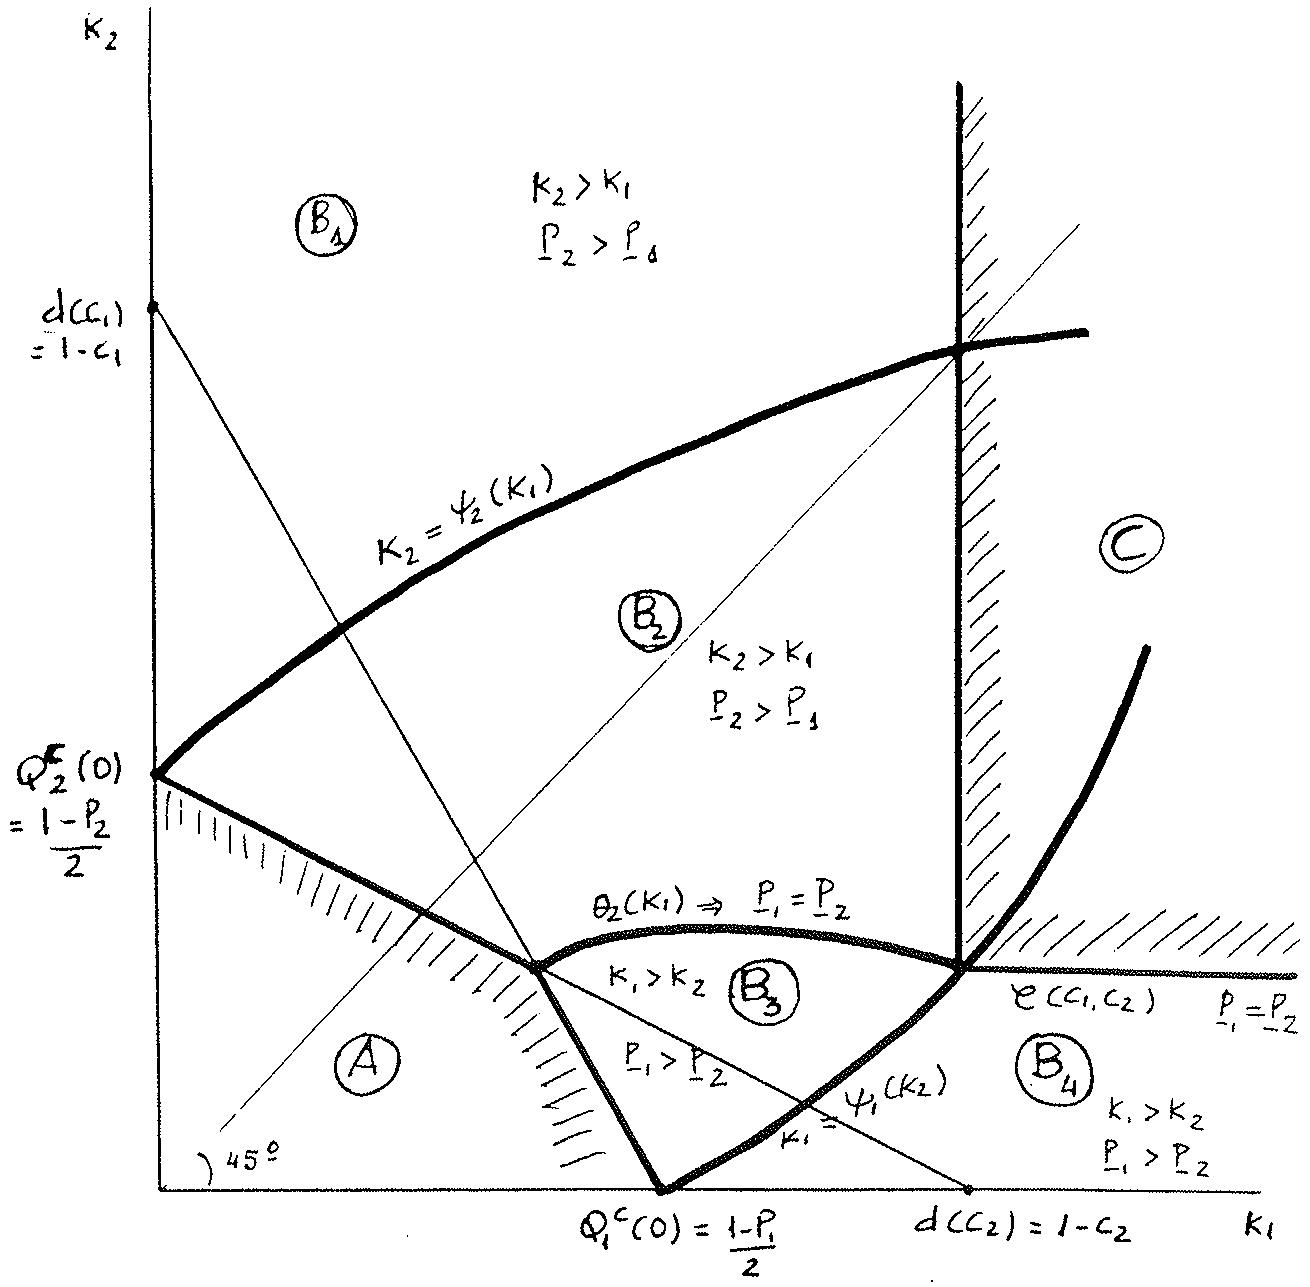
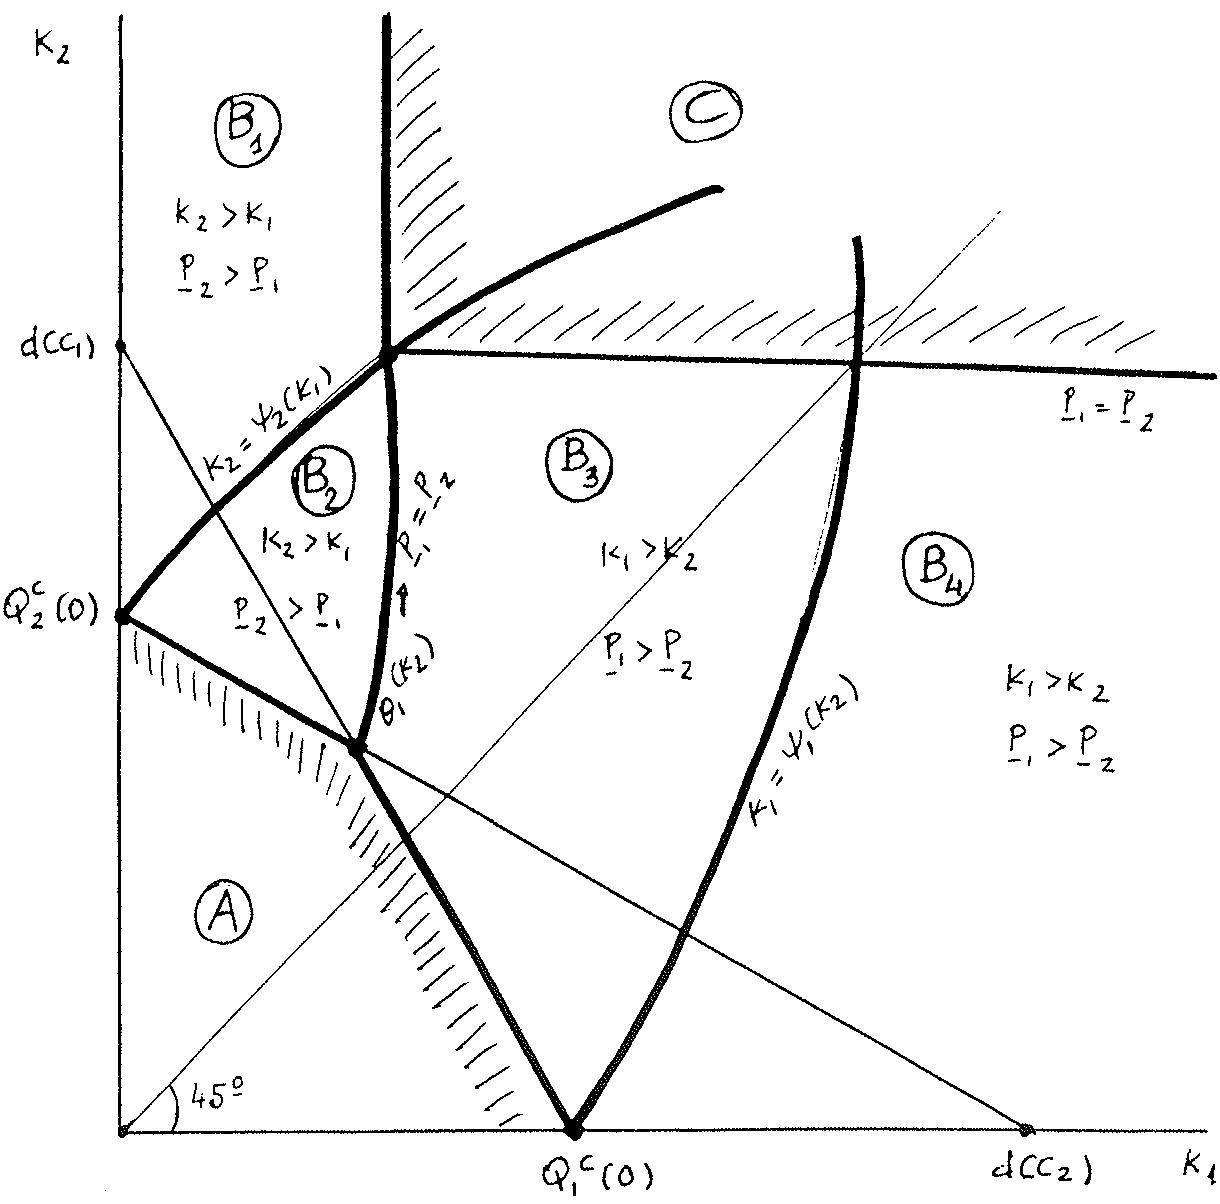
When differences in unit costs of production up to capacity are incorporated we obtain the same three regions of capacity as above. Note however, that region C (the Bertrand region) will lie in either the north-east region of the quadrant (if ), or in the south-east of it (if ), and that in this region the high cost firm is driven out of the market. When capacities lie in the region below the two Cournot best response functions (region A), the simultaneous-move game yield a pure strategy equilibria with . In the remaining region (region
As noted by Deneckere and Kavenock (1992), firms would have charge only two prices in equilibrium in a leader-follower setting, instead of a simultaneous-move one: or . Suppose . If firm 1 is a leader it sets and firm 2 matches that price (and sells its capacity). If firm 2 is a leader, it sets and firm 1 follows with . In region B, we have that and so firm 2 sets a strictly lower price as a leader than as a follower. The model then predicts that when 1, the large firm, is a leader it provides a price-umbrella for the small firm, allowing it to undercut (or match) and sell all of its capacity. The small firm, on the other hand, acts aggressively as a leader, by setting a low enough price to discourage undercutting or matching by the larger firm.
B), the simultaneous move yields a unique equilibrium in non-degenerate mixed strategies. However, there exists a continuous function partitioning region B into areas where and , with common boundary . Also these areas can be subdivided into subareas where at most one firm is capacity constrained.
Under our assumptions it can be proved that can be partitioned first into 2 connected subregions in which and with common boundary, , , for which and it is denoted by (if , or by if )
Next, if , then by the definition of , and implies that since , then
\[\underline {{P}} _ {1} = c _ {2} = \frac {1 + c _ {1}}{2} - \frac {1}{2} [ k _ {2} (2 (1 - c _ {1}) - k _ {2}) ] ^ {\frac {1}{2}} \quad \text {so that}\]
\[k _ {2} = \varphi (c _ {1}, c _ {2}) = 1 - c _ {1} - 2 [ (1 - c _ {2}) (c _ {2} - c _ {1}) ] ^ {\frac {1}{2}} (\text { straight line })\]
Capacity pairs with
\[\left. \begin{array}{l} k _ {1} \geq d (c _ {2}) \\ k _ {2} < \varphi (c _ {1}, c _ {2}) \end{array} \right\} \quad \mathrm{areinregionB}\]
Capacity pairs with
\[\left. \begin{array}{l} k _ {1} \geq d (c _ {2}) \\ k _ {2} \geq \varphi (c _ {1}, c _ {2}) \end{array} \right\} \mathrm{areintheclasicalBertrandregion} \equiv \mathrm{regionC}\]
For a more technical treatment see Allen et al. (1995).
Here equilibrium requires that the low-cost firm prices the high-cost firm out of the market.
Finally, the curves are the loci of points for which firm is exactly capacity constrained when it charges , i.e., .
Using these curves, we may further subdivide region B into four different regions:
Region :
(2 does not have capacity constrained)
(1 is capacity constrained)
and , hence
\[\Pi_ {2} ^ {*} = (\underline {{P}} _ {2} - c _ {2}) d (\underline {{P}} _ {2}) = H _ {2} ^ {*} (\underline {{P}} _ {2}) = H _ {2} ^ {* F}\]
\[\Pi_ {1} ^ {*} = L _ {1} (\underline {{P}} _ {2}) = (\underline {{P}} _ {2} - c _ {1}) k _ {1}\]
Region :
\[k _ {2} < d (\underline {{{P}}} _ {2})\]
\[k _ {1} < d (\underline {{{P}}} _ {1})\]
both firms are capacity constrained
and , hence
\[\Pi_ {2} ^ {*} = (\underline {{P}} _ {2} - c _ {2}) k _ {2}\]
\[\Pi_ {1} ^ {*} = (\underline {{{P}}} _ {2} - c _ {1}) k _ {1}\]
Region :
\[k _ {2} < d (\underline {{{P}}} _ {2})\]
\[k _ {1} < d (\underline {{{P}}} _ {1})\]
and , hence
\[\Pi_ {2} ^ {*} = (\underline {{{P}}} _ {1} - c _ {2}) k _ {2}\]
\[\Pi_ {1} ^ {*} = (\underline {{{P}}} _ {1} - c _ {1}) k _ {1}\]
Region :
\[k _ {2} < d (\underline {{{P}}} _ {2})\]
\[k _ {1} > d (\underline {{{P}}} _ {1})\]
(Firm 1 is not capacity constrained)
and , hence
\[\Pi_ {2} ^ {*} = (\underline {{{P}}} _ {1} - c _ {2}) k _ {2} = L _ {2} (\underline {{{P}}} _ {1})\]
\[\Pi_ {1} ^ {*} = (\underline {{{P}}} _ {1} - c _ {1}) d (\underline {{{P}}} _ {1}) = H _ {1} ^ {*} (\underline {{{P}}} _ {1}) = H _ {1} ^ {* F}\]
We may summarize the behavior outside the pure strategy region A as follows: when , firm 1 prices passively by providing a stochastic price umbrella for firm 2. When , the inequality holds if and only if , so that large firms price passively and small firms price aggressively. When , the region where strictly includes the region where ; when the opposite is true. Thus, high costs induce more passive pricing behavior.
The Nash equilibrium profits are as follows:
* In region A :
\[\Pi_ {i} ^ {*} = (1 - k _ {1} - k _ {2} - c _ {i}) k _ {i}, \quad i = 1, 2\]
* In region B :
\[\begin{array}{l} \Pi_ {1} ^ {*} = k _ {1} \left\{\left[ \frac {1 + c _ {2}}{2} \right] - \frac {1}{2} [ k _ {1} (2 (1 - c _ {2}) - k _ {1}) ] ^ {\frac {1}{2}} - c _ {1} \right\} \text {and} \\ \Pi_ {2} ^ {*} = \left[ \frac {(1 - k _ {1} - c _ {2})}{2} \right] ^ {2} \end{array}\]
* In region :
\[\Pi_ {i} ^ {*} = \frac {k _ {i}}{k _ {2}} \left[ \frac {(1 - k _ {1} - c _ {2})}{2} \right] ^ {2} + k _ {i} (c _ {2} - c _ {i}), \qquad i = 1, 2\]
* In region B3:
\[\Pi_ {i} ^ {*} = \frac {k _ {i}}{k _ {1}} \left[ \frac {(1 - k _ {2} - c _ {1})}{2} \right] ^ {2} + k _ {i} (c _ {1} - c _ {2}), \qquad i = 1, 2\]
* In region :
\[\Pi_ {1} ^ {*} = \left[ \frac {(1 - k _ {2} - c _ {1})}{2} \right] ^ {2}\]
\[\Pi_ {2} ^ {*} = k _ {2} \left\{\left[ \frac {1 + c _ {1}}{2} \right] - \frac {1}{2} \left[ k _ {2} \left(2 \left(1 - c _ {1}\right) - k _ {2}\right) \right] ^ {\frac {1}{2}} - c _ {2} \right\}\]
* In region C:
\[\Pi_ {i} ^ {*} = \max \{0, [ \min (\max (\frac {1 + c _ {i}}{2}, 1 - k _ {i}), c _ {j}) - c _ {i} ] \}.\]
\[[ 1 - \min (\max (\frac {1 + c _ {i}}{2}, 1 - k _ {i}), c _ {j}) ], \qquad i = 1, 2 \qquad j \neq i.\]
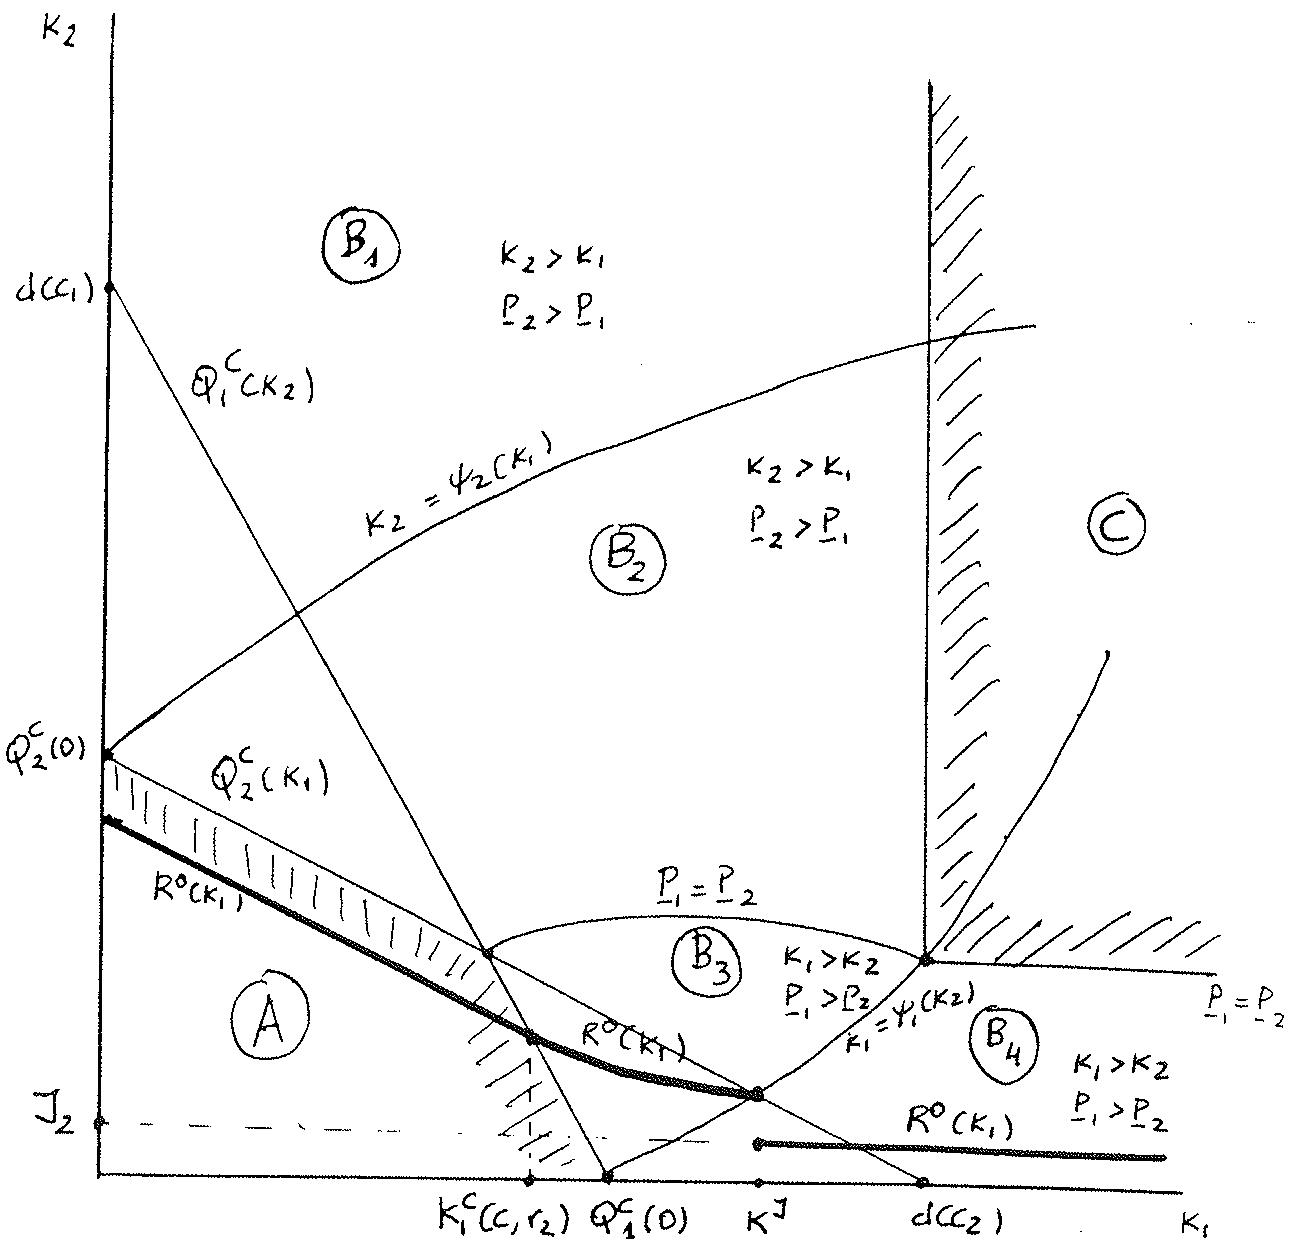
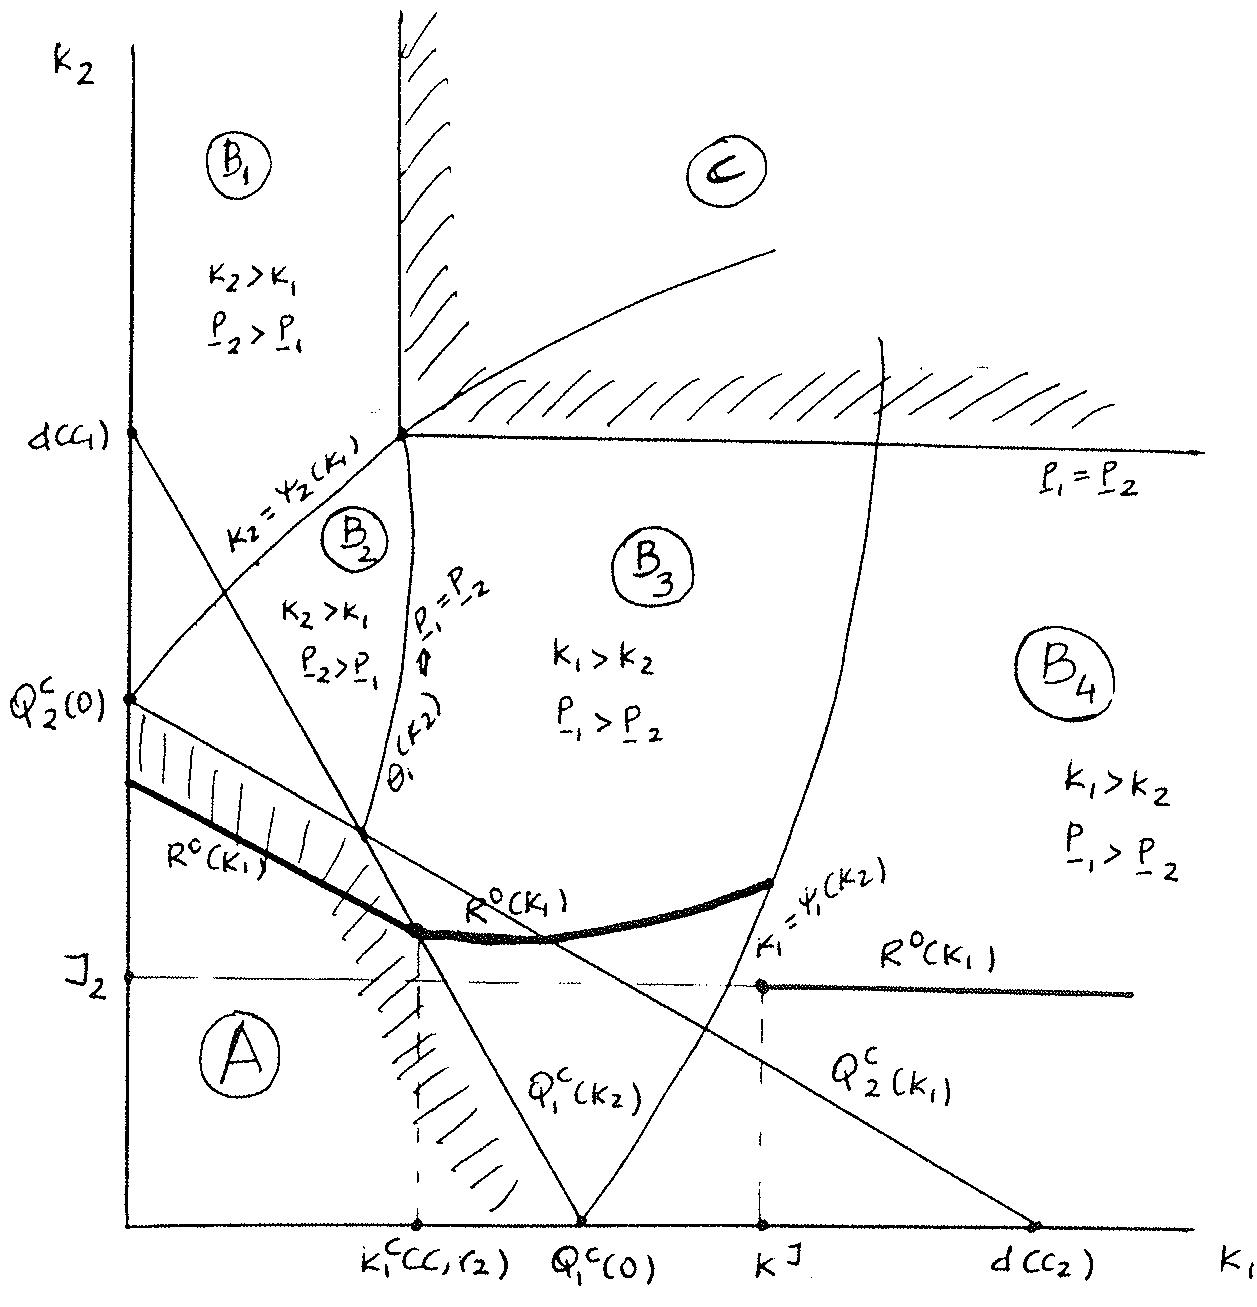
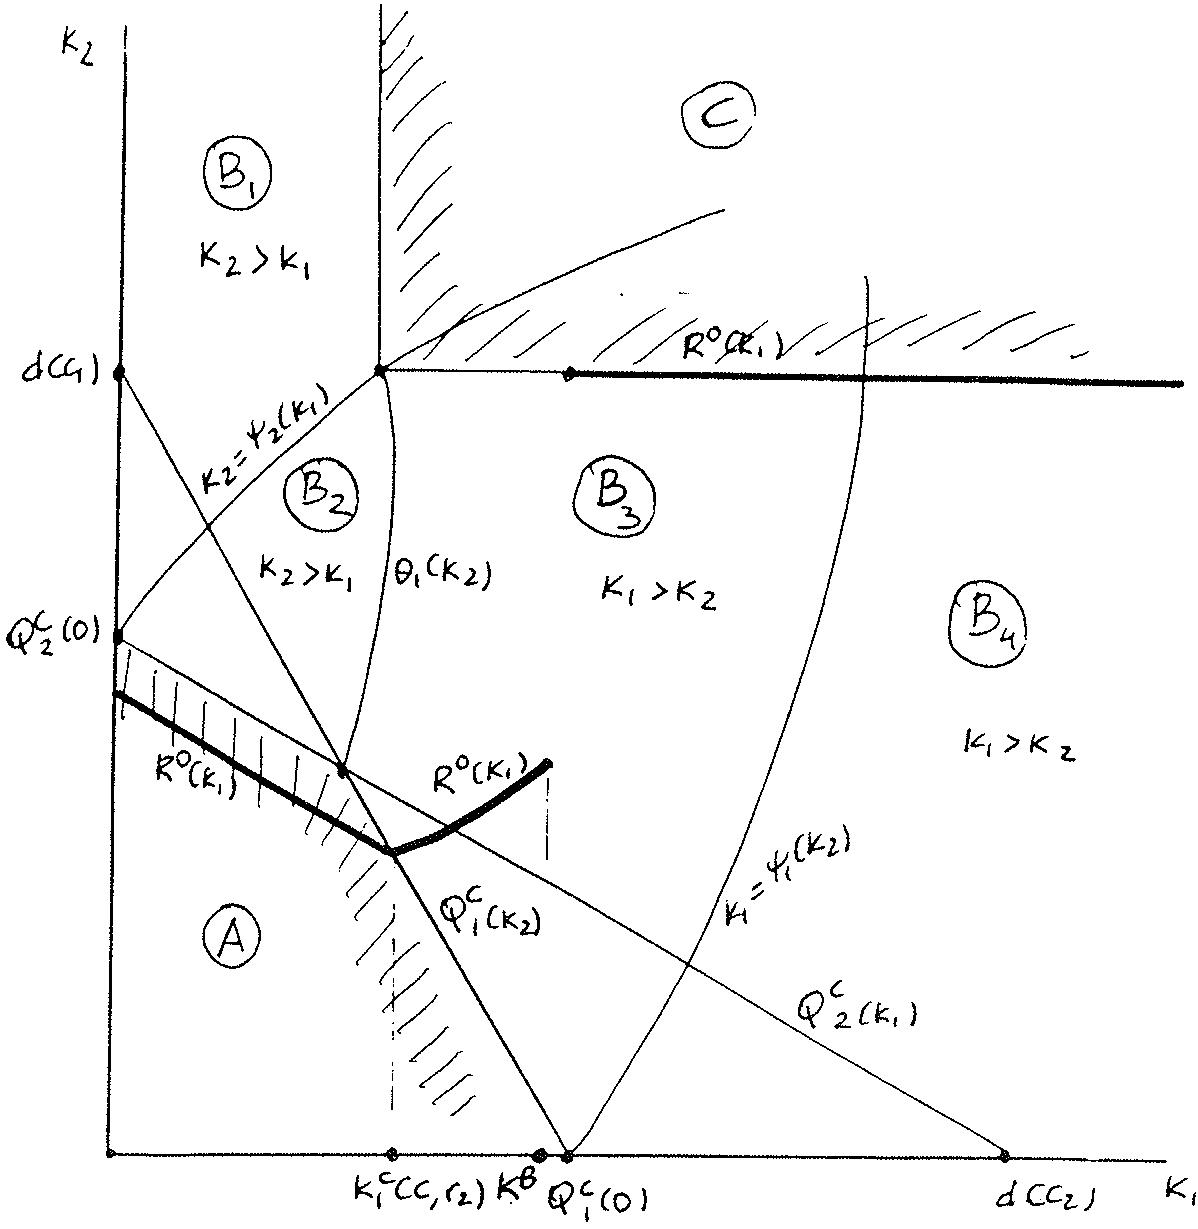
Graphically it would be
Insert Figures 2, 3 and 4
5. Second stage of the game:
Capacity-Best Response function of the entrant.
In the second stage of the game, the entrant, having observed the capacity choice of the incumbent and knowing the access price for capacity, he chooses to buy that level of capacity that maximizes its profits in the market competition. Hence, we derive next the follower's best response. Observe that the meaning of this best response is different from the standard quantity best-response function in the Cournot and Stackelberg models. In quantity-setting models a quantity placed on the market is a commitment to drive price down to the level that clears all quantity from the market. However, in our model of sequential choice followed by simultaneous price-setting, capacity is not a commitment to drive price down to the capacity clearing level.
This means that, for instance, when firms' costs are not too different and for capacities outside the region of pure strategies (region A), the larger firm acts relatively passively in pricing. Thus, the follower has an incentive to set a capacity above the quantity best-response function when the leader's capacity is sufficiently large. Also, very efficient firms (compared to rivals) will act more aggressively in setting capacity than they would in quantity-setting models. Hence, efficient followers need not take their rival's capacity as a commitment to sell, and instead they may decide to increase their own capacity to accommodate all the demand at their rival's unit cost of production. The potential for this type of aggressive response has an important effect on the behavior of a leader with high unit production costs.
From the equilibrium profits of the price-setting subgames we calculate the optimal capacity choices of the follower.
Let
\[\begin{array}{l} R (k _ {1}) = R (k _ {1}; r _ {2}) \equiv \arg \max _ {k _ {2}} \Pi_ {2} (k _ {1}, k _ {2} \mid c _ {1}, c _ {2}, r _ {2}, F _ {2}) \\ \equiv \arg \max _ {k _ {2}} \{\Pi_ {2} (k _ {1}, k _ {2} \mid c _ {1}, c _ {2}) - \rho_ {2} (k _ {2}) \}, \end{array}\]
be the follower's capacity best-response function, where , and
\[\begin{array}{l} R ^ {o} (k _ {1}) = R ^ {o} (k _ {1}; r _ {2}) \equiv \arg \max _ {k _ {2}} \Pi_ {2} (k _ {1}, k _ {2} \mid c _ {1}, c _ {2}, r _ {2}, 0) \\ \equiv \arg \max _ {k _ {2}} \left\{\Pi_ {2} (k _ {1}, k _ {2} \mid c _ {1}, c _ {2}) - r _ {2} k _ {2} \right\} \end{array}\]
Note that:
\[R (k _ {1}) = \left\{ \begin{array}{c} R ^ {o} (k _ {1}) \text {if} k _ {1} < k ^ {m} \\ 0 \text {if} k _ {1} \geq k ^ {m} \end{array} \right.\]
where
\[k ^ {m} \left(c _ {1}, c _ {2}, r _ {2}, F _ {2}\right) = \max \left\{k _ {1}: \Pi_ {2} \left(k _ {1}, R ^ {o} \left(k _ {1}\right) \mid c _ {1}, c _ {2}, r _ {2}, 0\right) \geq F _ {2} \right\}\]
We derive, without proof the best-response of the entrant. This best response will depend on the access price . We will show next, that for high enough access prices, the entrant will never select, for any , a "big" capacity level, independently of firms' efficiencies. However, for low enough access prices, the entrant's relative efficiency is important. Thus, if the follower is a quite efficient firm it could act very aggressively and select big capacity levels.
Lemma 4. Suppose that
\[\begin{array}{c} r _ {2} \geq \frac {1 - 2 c _ {2} + c _ {1}}{2}, t h e n R ^ {o} (k _ {1}) = Q _ {2} ^ {r _ {2}} (k _ {1}) w h e r e \\ Q _ {2} ^ {r _ {2}} (k _ {1}) = \max \{0, \frac {1}{2} (1 - k _ {1} - c _ {2} - r _ {2}) \} \end{array}\]
Graphically,
Insert Figure 5
Hence if , then is in region A.
The access price is so high that it is never optimal for firm 2 to select a capacity such that lies outside of region A, even if this firm is cost advantaged. Since all in region A lead to price-setting equilibria in which prices clear all the capacity from the market, coincides with .
Next, for lower access prices, i.e. if , then, lies in A, and . In particular, note that when , , i.e., it lies in .
coincides with for , where (the Cournot equilibrium), and for , lies entirely above , in and .
Note that in region , is independent of , so that let us define as , so that provides firm 2 with the highest profit attainable in .
Now, we look for the that separates 2's optimal response to be in or in :
\[\text {Define} k ^ {J} \left(c _ {1}, c _ {2}, r _ {2}\right) \equiv \inf \left\{k _ {1}: \max _ {\left\{k _ {2}: \left(k _ {1}, k _ {2}\right) \in B _ {3} \right\}} \Pi_ {2} \left(k _ {1}, k _ {2}\right) \leq \Pi_ {2} \left(B _ {4}, J _ {2}\right) \right\}\]
Then, for , firm 2's optimal response lies in and for firm 2's optimal response is in .
Finally, 2 could go to the Bertrand region (region C), by pricing , and getting . If it is impossible, but for , it could be the case.
Define , then
Lemma 5. Suppose , and . Then the capacity best response function is given by
\[R ^ {o} (k _ {1}) \left\{ \begin{array}{c c c} Q _ {2} ^ {r _ {2}} (k _ {1}) & i f & 0 \leq k _ {1} \leq k _ {1} ^ {C} (c _ {1}, r _ {2}) \\ \left\{\frac {2 (1 - c _ {1}) - | (1 - c _ {1}) ^ {2} - 1 2 k _ {1} (c _ {1} - c _ {2} - r _ {2}) | ^ {\frac {1}{2}}}{3} \right\} & i f k _ {1} ^ {C} (c _ {1}, r _ {2}) < k _ {1} < k ^ {J} \\ J _ {2} (c _ {1}, c _ {2}, r _ {2}) & i f & k _ {1} \geq k ^ {J} \end{array} \right.\]
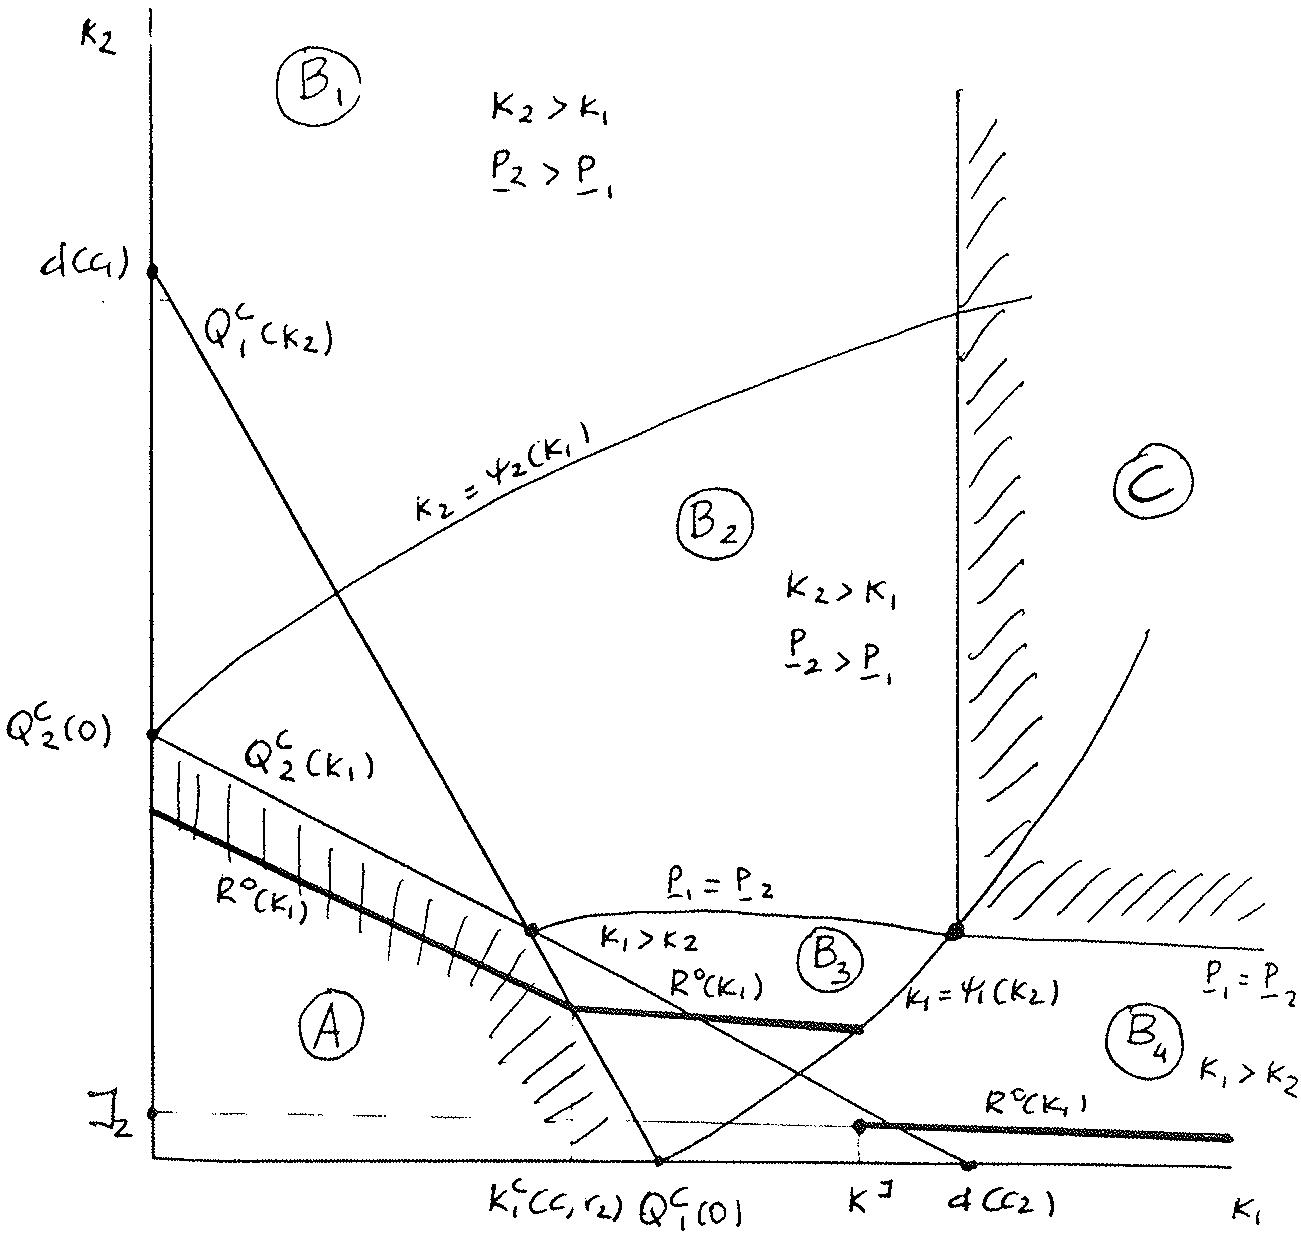
Note that the middle branch of lies in region . If , has a negative slope over this range, while if , it has a positive slope. Either way, jumps down when . At , firm 2's maximum profits from responding with a capacity that leaves firm 1 capacity constrained at equals its profits from setting , a capacity sufficiently small that firm 1 is not capacity constrained at . For firm 2 responds optimally by selecting its judo capacity .
\[(\text { Insert Figure 6 and } 7)\]
Next, suppose that . In other words the follower has a big cost advantage and is low enough. In this case the follower's best response may include to go to the Bertrand region, i.e. to throw the incumbent out of the market.
\[\begin{array}{l} \text {Define} k ^ {B} (c _ {1}, c _ {2}, r _ {2}) = \inf \left\{k _ {1}: d (c _ {1}) (c _ {1} - c _ {2} - r _ {2}) \geq \max \Pi_ {2} (k _ {1}, k _ {2}) \right\} \left\{k _ {2}: \right. \\ \left(k _ {1}, k _ {2}\right) \in A \cup B _ {3} \cup B _ {4} \} \end{array}\]
Then,
Lemma 6. Suppose , and , then
\[\begin{array}{r l} {R ^ {o} (k _ {1})} & {\left\{ \begin{array}{c c c} Q _ {2} ^ {r _ {2}} (k _ {1}) & \text {if} & k _ {1} \in [ 0, \min (k _ {1} ^ {C} (c _ {1}, r _ {2}), k ^ {B}) ] \\ \left\{\frac {2 (1 - c _ {1}) - | (1 - c _ {1}) ^ {2} - 1 2 k _ {1} (c _ {1} - c _ {2} - r _ {2}) | ^ {\frac {1}{2}}}{3} \right\} & \text {if} k _ {1} \in (\min (k _ {1} ^ {C} (c _ {1}, r _ {2}), k ^ {B}), k ^ {B}) \\ d (c _ {1}) & \text {if} & k _ {1} \geq k ^ {B} \end{array} \right.} \end{array}\]
Note that may be greater than or less : that is the jump in may occur in region A or region .
Graphically
\[(\text { Insert Figure 8 and 9 })\]
As noted earlier, a fixed set-up cost alters the capacity best-response function of the entrant only when it causes his profits to be non-positive. The follower opts for staying out of the market whenever the leader's capacity exceeds some critical capacity level , whose value depends on which of the conditions of Propositions 1-3 hold. In the Appendix we show the corresponding results when fixed set-up cost are included.
6. Equilibria for the full game.
In the first stage the leader chooses both its capacity , knowing that the entrant is capacity follower, and the access price that the entrant has to pay for the capacity that he buys. Alternatively we may consider that the leader chooses the total capacity of the industry, , and sells out to the follower.
Hence, the leader has to choose a triple such that he maximizes
\[= \Pi_ {1} ^ {*} (k _ {1}, R (k _ {1}); c _ {1}, c _ {2}) - r _ {1} (k _ {1} + R (k _ {1})) + r _ {2} R (k _ {1}) + F _ {2}.\]
Notice that if and are chosen such that the entrant is left with zero profits, the above expression is equivalent to
\[M a x _ {k _ {1}} \left\{\Pi_ {1} ^ {*} (k _ {1}, R (k _ {1}); c _ {1}, c _ {2}) + \Pi_ {2} ^ {*} (k _ {1}, R (k _ {1}); c _ {1}, c _ {2}) - r _ {1} (k _ {1}, R (k _ {1})) \right\}\]
Since depends on , the optimal action of the incumbent will be . Notice that , or , may belong to the region of pure strategies, region A, or to the region of non-degenerate mixed strategies, depending on the relative values of the parameters , and and on the choice variable .
Entry is accommodated if is such that the optimal response of the follower is to choose . Entry is blockaded if is such that . Entry is deterred if so that .
Given that and are also chosen by the leader and such that entry deterrence and blockaded entry are not permitted, we focus on the entry accommodation issue.
Making abstraction of , or assuming first that is small enough, we obtain the leader best as a function of , and .
Proposition 1. If , then where is the Stackelberg leader capacity.
Clearly, if , then is in the region of pure strategies, region A, so that the best that the incumbent can do is to pick up the Stackelberg leader capacity.
Next, consider the case where . In this situation the leader's best choice depends on the relationship between and .
Suppose first that the incumbent is cost advantaged, i.e. , or not too cost disadvantaged, . In this case is as in Lemma 5, and the best choice of the leader is either in region A of pure strategies or in region where it is not capacity constrained.
In the region of pure strategies (the Cournot capacity for costs , and ), meanwhile in region , . The choice between one or the another depends on the value of . For instance, if is very small is also very small and the best choice for firm 1 is . As increases, increases as well, and from some on the best choice of 1, changes to , the Cournot outcome. Thus,
Proposition 2. If , and , goes from to as goes from zero to higher but not big values.
For instance, if , the middle branch of , in Lemma 5 is flat since in region , firm 2's profits are now , and firm 1 is indifferent between and any other value in the middle branch of . In this case , for .
As increases, increases so that firm 1 will eventually prefer to .
However as keeps on increasing will shift to that of Lemma 6, i.e. and firm 1 is now cost disadvantaged.
\[(\text { Insert Figure } 1 0)\]
In this situation, the best choice of the leader is between and . If is not too big, , so that .
However, if is sufficiently big, then (the jump in is before ), and the outcome is that of reverse judo, where the leader is very cost disadvantaged and it chooses an small capacity in order that firm 2 does not price it out of the market. Hence,
Proposition 3. If , and , then goes from to as increases.
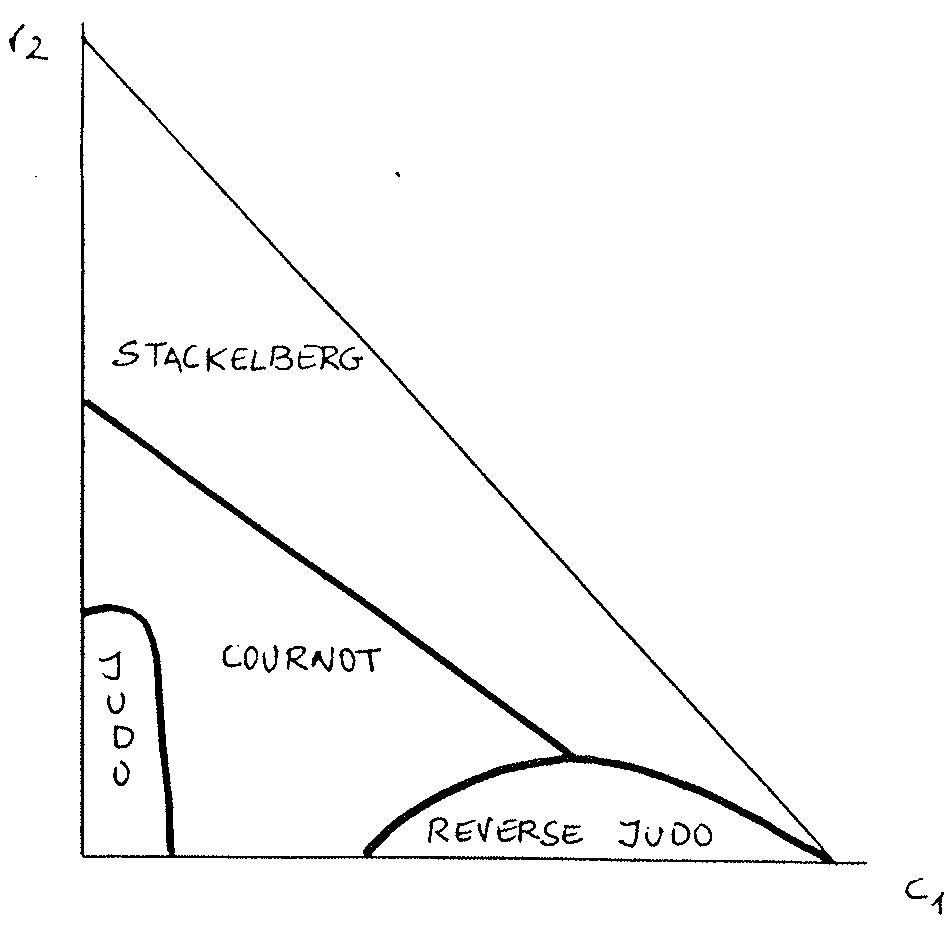
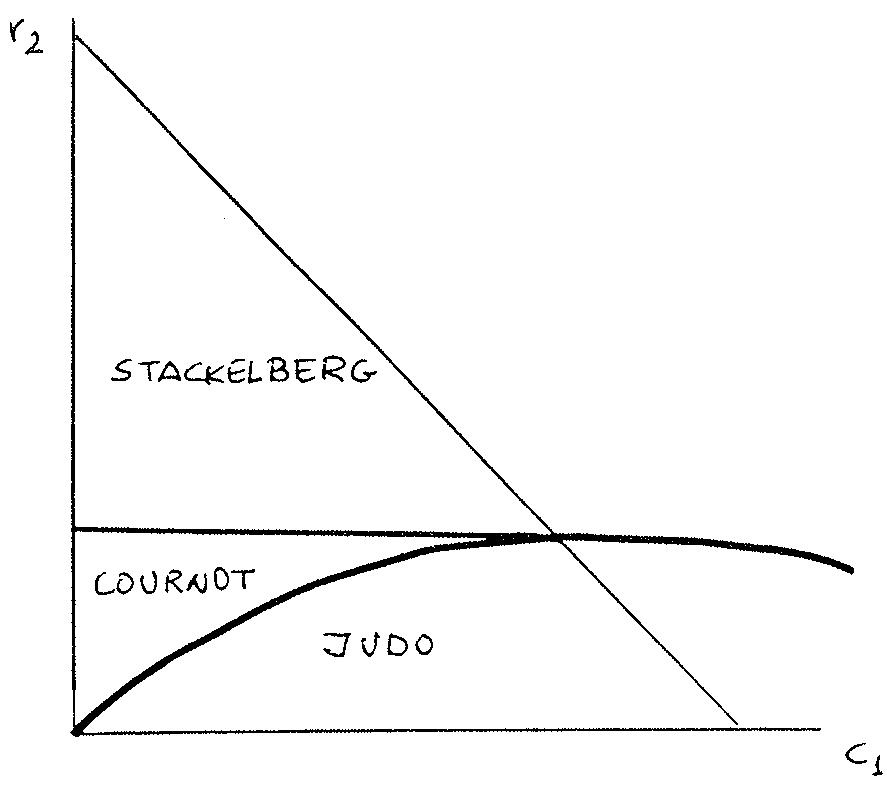
Graphically the above results can be summarized as follows:
(Insert Figures 11 and 12)
Hence, depending on the values of the access price (that the incumbent sets up simultaneously) and the cost parameters and , the model obtains a wide range of qualitatively distinct equilibrium outcomes for capacity levels. The relationship between the access price the equilibrium capacities and prices in the product market is the following:
1. For low access price, i.e. , the nature of equilibrium depends on unit production cost asymmetries.
a) If is low and the incumbent has a moderate costs disadvantage or if is intermediate (but ) and the firm's unit costs are not too different, the entry accommodation yields as the leader's capacity, i.e. the Cournot outcome. The follower responds with and firms set prices to clear all capacity from the market. i.e. price is driven down to a level that clears all capacity (in the region of pure strategies), . Hence we obtain the equilibrium values:
\[\begin{array}{r c l} k _ {1} ^ {C} (c _ {1}, c _ {2}, r _ {1}, r _ {2}) & = & \frac {1 - 2 c _ {1} + c _ {2} - 2 r _ {1} + r _ {2}}{3} \\ k _ {2} ^ {C} (c _ {1}, c _ {2}, r _ {1}, r _ {2}) & = & \frac {1 - 2 c _ {2} + c _ {1} - 2 r _ {2} + r _ {1}}{3}, w i t h \\ P _ {1} & = & P _ {2} = P (k _ {1} ^ {C} + k _ {2} ^ {C}) = 1 - k _ {1} ^ {C} - k _ {2} ^ {C}, w h e r e \\ 1 - k _ {1} ^ {C} - k _ {2} ^ {C} & = & \frac {1 + c _ {1} + c _ {2} + r _ {1} + r _ {2}}{3} \end{array}\]
b) When is low and the incumbent has the lower cost of production or if it is not too cost disadvantaged, "Judo-like" behaviour arises. In judo equilibrium, the incumbent sets a large capacity and the entrant a small capacity, so that a non-degenerate mixed strategy arises at the price-setting game.
This solution captures the image of a small firm using its rival's large size to its own advantage, and relates directly to Gelman and Salop (1986) model of "judo economics". Their model deals with the incentive of a cost-disadvantaged entrant to keep its scale of operation small, the cost-advantaged incumbent is assumed to have enough capacity to serve the entire market. The entrant first decides upon a scale of operation, and a price to charge. The incumbent then follows with its choice of price. Thus, the entrant is a price-leader. Gelman and Salop show that it is optimal to choose a capacity-price pair which will deter the incumbent from undercutting or matching and which gives the entrant positive profits.
In our model, the solution is on the region of price-setting mixed strategies with , and hence , that implies that firm 2 can undercut or match firm 1's price. Thus the equilibrium price (in mixed strategies) for firma 1 is:
\[\underline {{{P}}} _ {1} > P (k _ {1} + k _ {2}) = 1 - k _ {1} ^ {J} - J\]
where is the price at which firm 1 is indifferent between being the low-priced firm or being the high-priced firm, and capacities are such that at , firm 2's maximum profit from responding with a capacity that leaves firm 1 capacity constrained at equals its profit from setting , a capacity sufficiently small that firm 1 is not capacity constrained at . Hence firm 2 selects its judo capacity for and firm 1 sets higher prices on average than the entrant and both reduce output below capacity.
Note that by choosing (the monopoly price for the residual demand) firm 1 can always guarantee for itself its profits. If firm 1 were to choose as a leader it would price up , and firm 2 would also choose as a follower.
Hence where , firm 1 provides an stochastic price-umbrella i.e. it prices passively.
Observe that if is not too big, then is close to the monopoly of the market demand. Thus, under the judo solution, industry price is expected to be higher than under Cournot and market capacity lower.
c) Finally, if firm 1 is very cost-disadvantaged, i.e. by a big amount, the solution is that of "reverse judo", where the leader chooses an small capacity in order that firm 2, the very efficient entrant, does not price it out of the market. Hence the incumbent reduces capacity below the Stackelberg level to avoid aggresive answer by the entrant. This one sets a capacity along its best response and production takes place at full capacity with prices in region A (pure strategies). In particular, , where is now the reverse judo solution for firm 1, but in region A, since as a leader it can avoid to jump to the region where .
2. For high access price, i.e. when , the solution leads to Stackelberg behaviour. The leader reduces capacity down to the Stackelberg outcome and prices clear up the full capacity
\[\begin{array}{r c l} P _ {1} & = & P _ {2} = P (k _ {1 L} ^ {S} + k _ {2 F} ^ {S}) = 1 - k _ {1 L} ^ {S} - k _ {2 F} ^ {S}, w h e r e \\ k _ {1 L} ^ {S} & = & \frac {1 - 2 c _ {1} + c _ {2} - r _ {1}}{2} \\ k _ {2 F} ^ {S} & = & \frac {1 + 2 c _ {1} - 3 c _ {2} + r _ {1} - 2 r _ {2}}{4}, a n d \\ P ^ {S} & = & \frac {1 + 2 c _ {1} + c _ {2} + r _ {1} + 2 r _ {2}}{4} \end{array}\]
Note that if the incumbent is not very efficient (Cournot) and , i.e. industry capacity is smaller than the Cournot solution.
Once we have analyzed the incumbent's capacity choice let us turn back to the access price choice.
The leader charges the entrant a variable price and a lump-sum cost . From the leader's maximization problem it is clear that and explicit solutions depend on the relationship among them. However, some qualitative features of the solution can be highlighted.
a) The case of the relatively efficient network monopolist.
If firm 1 is quite efficient or not too cost disadvantaged it will choose an access price not too high, i.e. an , in order to implement the "judo solution".
By this pricing, prices in the product market are high enough and the incumbent behaves as "almost" a monopolist. In fact, it is a monopolist in the residual demand, which is quite big since the judo capacity of firm 2, , is quite small. Notice that the more efficient the incumbent is, the smaller is , and hence the higher its monopoly power. Also, the less efficient the lower has to be to price up the judo outcome.
Since the incumbent pays a variable unit cost of per unit of capacity, it could be the case that . In this situation the incumbent may cross-subsidy its pricing below marginal cost. If , and the incumbent is not cost-disadvantaged it can price at marginal cost.
Industry capacity will be high but competition will not be important here. Prices in the final service market will be high. In fact, the leader will provide with an stochastic price umbrella for the entrant, who can undercut the leader.
b) The case of the relatively inefficient network monopolist.
However, if firm 1 is quite disadvantaged in cost, the judo solution may not maximize its profit. This is so because J (the judo capacity of firm 2) increases with and hence decreases, so that to be a monopolist on the residual demand pays less than being a Cournot competitor.
Under this situation the best that the incumbent can do is to choose a high access price , to reduce industry capacity to the Stackelberg outcome and to price in the product market higher than under Cournotian competition. With this strategy, the monopolist remains active in the final service market even if it is a highly inefficient firm. In that case, its capacity and output will be quite small, but the entrant will not be able to price him out of the market.
c) The case of the relatively symmetric firms.
If firms are cost symmetric, , it can prove that profits for the incumbent are higher under a high access price , and hence, under the Stackelberg solution . The same solution is the outcome for production costs not too different from each other.
If the capacity cost of the incumbent, , is not too big, this solution implies a big reduction of industry capacity and hence high prices in the final service market. Also the entrant is paying a high access price to produce the final services.
Stackelberg versus liberalized Cournot capacities.
If we compare total industry capacity and market prices for the final service under the Stackelberg and under a liberalized Cournot solution where the access price , we find the following features. Let and be the industry capacities under Stackelberg and liberalized Cournot respectively, then:
It can be checked that firm 1 differences in profits under Stackelberg and Cournot when production costs are the same, are:
where , and .
.
With
Also let , and , then
if
.
Observe that the function , is increasing in , in and decreasing in
c2
Also, and
Now, for different production costs:
if
If firms are equally efficient, then industry capacity is smaller under Stackelberg than under liberalized Cournot, and hence the final service market is higher under the former solution. Also, access prices are higher under Stackelberg.
If firm 1 is more efficient than firm 2, or if firm 1 is quite inefficient, the Stackelberg solution always implies a lower industry capacity than the one under liberalized Cournot. Finally, for a moderate cost disadvantaged monopolist, the industry capacity comparison depends on . If it is not too big the previous outcome will be repeated.
Hence, our theoretical findings match most of the empirical evidence from the European Union and the OECD countries.
7. Final Comments
In this paper we have tried to raise a question mark about the economic case for the consideration of telecommunication infrastructure as a natural monopoly. The early work putting forward ideas for the deregulation of utilities like Demsetz (1968) did not question the natural monopoly status of the networks.
Empirical evidence about the unsatisfactory performance of monopolized telecommunication infrastructure markets has been recently provided by the European Union and OECD countries.
If , and , with , and , if where if , and if .
If ,
If , and , with .
Our theoretical model, where the strategy space of the incumbent monopolist includes both access prices and capacity choices provides a theoretical setting that permits to draw some interesting insights about the choices open to the incumbent monopolist. In particular, there are several theoretically possible outcomes in this setting. However, none of them is satisfactory from the point of view of competition in the final service market nor in terms of the development of the network. In the case of an efficient monopolist, the capacity choice gives a relatively large network size, but the impact of entry is quite limited as prices for the final services remain high. On the other hand, for less efficient incumbents, they will restrain the growth of the network and competition will not be very active either. More importantly, the access price will be quite high and this will discourage entry and the development of markets for new services. Our findings provide some theoretical background for the above empirical evidence.
However, it is far early to draw conclusions based on sound economic reasons. Evidence and theory seem to point out that we are working in a world of "second-best solution" and it is quite difficult to carry out clear-cut comparisons in terms of social welfare in that context. The duplication of networks does have an impact in terms of social costs. It implies the extra allocations of resources from other sectors. But, infrastructure competition seems to have beneficial effects in terms of competition and individual market performance. Therefore, there is a clear trade-off in terms of costs and performance for the economy as a whole with a net effect very difficult to evaluate.
APPENDIX.
Under the conditions of Lemma 4 we have
Proposition 4. Suppose , then
\[R (k _ {1}) = \left\{ \begin{array}{c} R ^ {o} (k _ {1}) \text {if} k _ {1} < k ^ {m} \\ 0 \text {if} k _ {1} \geq k ^ {m} \end{array} \right\}\]
where
Observe that in this case , where
\[Q _ {2} ^ {F} (k _ {1}) = \left\{ \begin{array}{c c} \frac {1}{2} (1 - k _ {1} - c _ {2} - r _ {2}) & \text {if} k _ {1} < 1 - c _ {2} - r _ {2} - 2 \sqrt {F _ {2}} \\ 0 & \text {otherwise} \end{array} \right\}\]
In other words, the outcome of our game coincides with the Stackelberg outcome.
Proposition 5. Suppose , , then
\[R (k _ {1}) = \left\{ \begin{array}{c} R ^ {o} (k _ {1}) \text {if} k _ {1} < k ^ {m} \\ 0 \text {if} k _ {1} \geq k ^ {m} \end{array} \right\}\]
where is
\[k ^ {m} = \left\{ \begin{array}{c} \infty \qquad i f \qquad \Pi_ {2} (k ^ {J}, J _ {2} \mid c _ {1}, c _ {2}, r _ {2}, 0) > F _ {2} \\ \gamma (c _ {1}, c _ {2}, r _ {2}, F _ {2}) i f \Pi_ {2} (k ^ {J}, J _ {2} \mid c _ {1}, c _ {2}, r _ {2}, 0) \leq F _ {2} < \\ \Pi_ {2} (k ^ {C} (c, r _ {2}) \mid c _ {1}, c _ {2}, r _ {2}, 0) \\ 1 - c _ {2} - r _ {2} - 2 \sqrt {F _ {2}} i f F _ {2} \geq \Pi_ {2} (k ^ {C} (c, r _ {2}) \mid c _ {1}, c _ {2}, r _ {2}, 0) \end{array} \right\}\]
Note that for , is constant at the level and lies in , where Sub-game equilibrium profits are independent of . Hence, if then coincides with the expression for given in Lemma 5. When the jump point lies on the second branch of in Proposition 2. Finally, when the jump point occurs to the left of so that is equal to .
The remaining two proposition parallel Lemma 6.
Proposition 6. Suppose , , and
\[R (k _ {1}) = \left\{ \begin{array}{c} R ^ {o} (k _ {1}) \text {if} k _ {1} < k ^ {m} \\ 0 \text {if} k _ {1} \geq k ^ {m} \end{array} \right\}\]
where
\[k ^ {m} = \left\{ \begin{array}{c} \infty \quad i f \quad d (c _ {1}) (c _ {1} - c _ {2} - r _ {2}) > F _ {2} \\ \gamma (c _ {1}, c _ {2}, r _ {2}, F _ {2}) i f d (c _ {1}) (c _ {1} - c _ {2} - r _ {2}) \leq F _ {2} < \\ \Pi_ {2} (k ^ {C} (c, r _ {2}) \mid c _ {1}, c _ {2}, r _ {2}, 0) \\ 1 - c _ {2} - r _ {2} - 2 \sqrt {F _ {2}} i f F _ {2} \geq \Pi_ {2} (k ^ {C} (c, r _ {2})) \end{array} \right\}\]
When , coincides with . Fixed costs are the small enough that for the follower prefers to price the leader out of the market. When , the jump point occurs on the upward-sloping branch of given by the middle expression of Lemma 6. Finally, when , .
In the next Proposition, .
Proposition 7. Suppose that , , and
\[R (k _ {1}) = \left\{ \begin{array}{c} R ^ {o} (k _ {1}) \text {if} k _ {1} < k ^ {m} \\ 0 \text {if} k _ {1} \geq k ^ {m} \end{array} \right\}\]
where
\[k ^ {m} = \left\{ \begin{array}{c} \infty \qquad i f \qquad d (c _ {1}) (c _ {1} - c _ {2} - r _ {2}) > F _ {2} \\ 1 - c _ {2} - r _ {2} - 2 \sqrt {F _ {2}} i f F _ {2} \geq d (c _ {1}) (c _ {1} - c _ {2} - r _ {2}) \end{array} \right\}\]
Note that here, jumps directly from region A to region C. If , there is no change in the follower's capacity best response. If this inequality is reversed, .
References
- [1] Allen, B., Deneckere, R., Faith, T. and Kovenock, D. (1995), "Capacity Pre-commitment as a Barrier to entry: A Bertrand-Edgeworth Approach", Working paper.
- [2] Allen, B. (1993), "Capacity Precommitment as an Entry Barrier for Price-Setting Firms", International Journal of Industrial Organization 11, 63-72.
- [3] Allen, B. and M. Hellwig (1986), "Price-Setting Firms and the Oligopolistic Foundations of Perfect Competition", American Economic Review, Papers and Proceedings, 76, 387-392.
- [4] Bain, J. S. (1956), Barriers to New Competition, Cambridge: Harvard University Press.
- [5] Basu, K. and N. Singh (1990), "Entry-Deterrence and Stackelberg Perfect Equilibria", International Economic Review 31, 61-71.
- [6] Baumol, W.J. and Sidak, G. (1994), Towards competition in local telephone, Cambridge, MIT Press.
- [7] Bulow, J., J. Geanakoplos, and P. Klemperer (1985), "Holding Idle Capacity to Deter Entry", Economic Journal 95, 178-182
- [8] Davidson, C. and R. Deneckere (1986), "Long-Run Competition in Capacity, Short-Run Competition in Price, and the Cournot Model", Rand Journal of Economics 17, 404-415.
- [9] Demsetz, H. (1968) "Why regulate utilities?, Journal of Law and Economics, 11, April, 55-65.
- [10] Deneckere, R. and D. Kovenock (1989a), "Capacity-Constrained Price Competition When Unit Costs Differ", Purdue University, Krannert Graduate School of Management Working Paper No. 958.
- [11] Deneckere, R. and D. Kovenock (1989b), "Capacity-Constrained Price Competition When Unit Costs Differ", Northwestern University, (revised) CMSEMS Discussion Paper No. 861.
- [12] Deneckere, R. and D. Kovenock (1992), "Price Leadership", Review of Economic Studies 59, 143-162.
- [13] Dixit, A. (1979), "A Model of Duopoly Suggesting a Theory of Entry Barriers", Bell Journal of Economics 10(1), 20-32.
- [14] Dixit, A. (1980), "The Role of Investment in Entry Deterrence", Economic Journal 90, 95-106.
- [15] Dixon, H. (1985), "Strategic Investment in an Industry with a Competitive Product Market", Journal of Industrial Economics 33(4), 483-499.
- [16] Edgeworth, F. Y. (1925), "Pure Theory of Monopoly", in F. Y. Edgeworth, Papers Relating to Political Economy (New York: Burt Franklin), Vol. I., Chapter E, 111-142.
- [17] Faith, T. (1990) "Bertrand-Edgeworth Competition with Sequential Capacity Choice", Erasmus Universiteit Rotterdam, Econometric Institute Report 9062/A.
- [18] Fudenberg, D. and J. Tirole (1984), "The Fat Cat Effect, the Puppy Dog Ploy and the Lean and Hungry Look", American Economic Review, Papers and Proceedings, 74, 361-368.
- [19] Gelman, J.R. and S.C. Salop (1983), "Judo Economics: Capacity Competition and Coupon Competition", Bell Journal of Economics 14, 315-325.
- [20] Gilbert, R.J. (1986), "Preemptive Competition", in Stiglitz, J.E. and F. Mathewson, eds., New Developments in the Analysis of Market Structure, Cambridge: MIT Press, 90-125.
- [21] Hunsaker, J. (1993), "The Pattern of Exit from Declining Industries", Purdue University, Ph.D. Thesis.
- [22] Kreps, D. and J. Scheinkman (1983), "Quantity Precommitment and Bertrand Competition Yield Cournot Outcomes", Bell Journal of Economics 14, 326-337.
- [23] Kydland, F.E. and E.C. Prescott (1982), "Time to Build an Aggregate Fluctuations", Econometrica 50, 1345-1370.
- [24] Lafont, J.J. and Tirole, J. (1995), "Creating Competition through Interconnection: Theory and Practice", Toulouse, mimeo.
- [25] Levitan, R. and M. Shubik (1972), "Price Duopoly and Capacity Constraints", International Economic Review 13(1), 111-122.
- [26] Modigliani, F. (1958), "New Developments on the Oligopoly Front", Journal of Political Economy 66(3), 215-232.
- [27] Saloner, G. (1985), "Excess Capacity as a Policing Device", Economics Letters 18, 83-86.
- [28] Scherer, F.M., A. Beckenstein, E. Kaufer, R. D. Murphy (1975), The Economics of Multi-Plant Operations, Cambridge: Harvard University Press.
- [29] Shapiro, C. (1989), "Theories of Oligopoly Behavior", in R. Schmalensee and R.D. Willig, eds., Handbook of Industrial Economics (Amsterdam: North-Holland), Chapter 6, 329-410.
- [30] Spence, A.M. (1977), "Entry, Capacity, Investment and Oligopolistic Pricing", Bell Journal of Economics 8, 534-544.
- [31] Spulber, D.F. (1981), "Capacity, Output and Sequential Entry", American Economic Review 71, 503-514.
- [32] Stiglitz, J.E. (1987), "Technological Change, Sunk Costs and Competition", Brookings Papers on Economic Activity 3, 883-937.
- [33] Sylos-Labini, P. (1969), Oligopoly and Technical Progress, Cambridge: Harvard University Press.
- [34] Tirole, J. (1988), The Theory of Industrial Organization, Cambridge: MIT Press.
- [35] Ware, R. (1985), "Sunk Costs and Strategic Commitment: A Proposed Three-Stage Equilibrium", Economic Journal 94, 370-378.
High Capacity Leased Circuit Prices in ECU (at 1.1.94)
| EU half circuits | Rental to nearest EU | Rental furthest EU |
| B | 21.793 | 29.380 |
| DK | 17.658 | 19.865 |
| D | 27.889 | 33.422 |
| GR | 26.115 | 33.174 |
| E | 30.192 | 30.821 |
| F | 24.185 | 31.815 |
| IRL | $4.027^2$ | 30.312 |
| I | 27.685 | 33.769 |
| L | 16.739 | 27.170 |
| NL | 18.700 | 24.933 |
| P | 21.117 | 31.777 |
| UK(BT) | $10.041^3$ | 40.778 |
| UK(MCL) | 8.817 | 23.958 |
| EU | 20.461 | 29.901 |
| EU Total circuit price $^{4}$ | 40.922 | 59.802 |
| US | $4.601^{5}$ | 6.236 |
Source: Coopers & Lybrand, 1994
Rental charges are in ecu for a 2 Mbit/s line on 1-year contracts. Some TOs offer discounts for longer term contracts. High volume discount schemes offered by some TOs have not been taken into consideration.
Note: these tariffs are subject to change and therefore for further details refer to national regulatory authorities.
Irish circuits to the UK are distance-dependent. The charge is made up of a fixed cross channel charge and a mainlink which is distance-dependent. A link for Dublin has been taken in this instance.
BT's charges to Ireland are distance-dependent and the cost is for a link from London to Nefyn, the UK charging point, with an approximate distance of 340 km.
Sum of two average circuit halves.
Figures represent AT&Ts charges for a 1.5 Mbit/s (T1) from New York to Washington (320 km) and from New York to Chicago (1.100 km).
RANKING INTERNET ACCESS PROVIDER CHARGES (DIAL-UP), August 1995
| OCDE Countries (Infrastructure competition exist in shaded countries) | 20 hours per month1, US$PPP | 30 hours per month1, US$PPP | Average | Possible extra charge based usage |
| Australia (November 1995) $^{2}$ | 10.45 | 16.54 | 13.49 | |
| UK | 14.67 | 14.67 | 14.67 | |
| NZ | 15.26 | 15.26 | 15.26 | YES |
| Finland | 18.85 | 18.85 | 18.85 | |
| US | 20.64 | 20.64 | 20.64 | |
| Netherlands | 21.13 | 21.13 | 21.13 | |
| Canada | 15.96 | 27.96 | 21.96 | |
| Iceland | 24.35 | 24.35 | 24.35 | |
| Sweden | 25.10 | 25.10 | 25.10 | |
| Australia (November 1995) $^{3}$ | 29.41 | 29.41 | 29.41 | |
| Spain (November 1995) $^{5}$ | 35.10 | 35.10 | 35.10 | |
| Norway | 35.69 | 53.07 | 44.38 | |
| Switzerland | 46.95 | 55.95 | 51.45 | |
| Portugal | 42.25 | 67.25 | 54.75 | |
| Austria | 59.32 | 59.32 | 59.32 | |
| Australia (August 1995) $^{3}$ | 51.74 | 77.21 | 64.48 | |
| Japan (November 1995) $^{4}$ | 53.04 | 86.19 | 69.61 | |
| France | 61.37 | 91.39 | 76.38 | |
| Greece | 77.39 | 77.39 | 77.39 | YES |
| Mexico | 80.41 | 80.41 | 80.41 | |
| Denmark | 67.48 | 99.64 | 83.56 | |
| Turkey | 72.97 | 117.97 | 95.47 | |
| Italy | 79.08 | 117.82 | 98.45 | |
| Belgium | 108.36 | 108.36 | 108.36 | |
| Japan (August 1995) $^{4}$ | 109.57 | 109.57 | 109.57 | |
| Germany | 108.06 | 162.09 | 135.08 | |
| Ireland | 153.49 | 153.49 | 153.49 | |
| Luxembourg | 154.65 | 154.65 | 154.65 | |
| $Spain^5$ | 218.96 | 345.01 | 281.99 | |
| OECD | 67.35 | 83.94 | 75.65 | |
| Infrastructure Competition | 33.97 | 38.66 | 36.32 | |
| No Infrastructure Competition | 83.05 | 105.25 | 94.15 | |
Source: OECD
Includes 20 or 30 calls of one hour duration and connection (or set up charge) spread over 36 months.
Netspace price for non-commercial users in November 1995.
Acay price in November 1995 and in August 1995
InfoWeb price for November 1995 and Tokyo Internet for August 1995.
Abaforum price for November 1995 and Eunet price for August 1995
OCDE average excludes Australian and Spanish data for November 1995.
COLECCION RESUMENES
96-02: "Evidencia empírica de sustituibilidad entre los componentes sectoriales del ahorro nacional en algunos países de la Unión Europea", Isabel Argimón.
96-01: "El mercado de depósitos español (1985-1994): Bancos versus Cajas de Ahorro", Juan Coello.
95-01: "Geografía económica y política territorial", CEP, FEDEA (Coordinador), IKEI e IVIE.
TEXTOS EXPRESS
96-02: "La Unión Económica y Monetaria en Europa", encuesta coordinada por: Miguel Sebastián y Simón Sosvilla.
96-01: "La Seguridad Social del siglo XXI y la reforma de las pensiones de 1996", José A. Herce.
DOCUMENTOS DE TRABAJO
96-26: "Capacity and access princing strategies: An argument for the liberalization of telecommunication infrastructure", A. Urbano, G. Olcina y Y Tauman.
96-25: "La reforma de las pensiones en España: Aspectos analíticos y aplicados", José A. Herce.
96-24: "Transitional Effects of a Pension System Change in Spain", José M. Bailén y Joan Gil.
96-23: "Convergencia real en la Unión Europea: Un análisis de series temporales", Vicente Esteve y Vicente J. Pallardó.
96-22: "Monetary Union and european unemployment", José Viñals y Juan F. Jimeno.
96-21: "El equilibrio financiero de un sistema de reparto de pensiones de jubilación: Una explicación al caso español", Juan F. Jimeno y Omar Licandro.
96-20: "The effects of migration on the relative demand of skilled versus unskilled labour: Evidence from Spain", Juan J. Dolado, Juan F. Jimeno y Rosa Duce.
96-19: "The causes of Spanish unemployment: A structural var approach", Juan J. Dolado y Juan F. Jimeno.
96-18: "La Unión Económica y Monetaria en Europa: Una encuesta entre expertos académicos y de mercados", Miguel Sebastián y Simón Sosvilla.
96-17: "Externalities and Growth in the Spanish Industries", Berta Moreno.
96-16: "Replacement Echoes in the Vintage Capital Growth Model", Raouf Boucekkine, Marc Germain and Omar Licandro.
96-15: "La industria en las Comunidades Autónomas: 1978-1992", José A. Herce, Juan J. de Lucio y Ana Goicolea.
96-14: "Externalities and industrial growth: Spain 1978-1992", Juan J. de Lucio, José A. Herce y Ana Goicolea.
96-13: "Bases para profesionalizar la sanidad pública", Benito Arruñada.
96-12: "Capacity utilization and market power", J-Fr. Fagnart, Omar Licandro y H. R. Sneessens.
Este texto se ha extraído automáticamente del documento original. Para citarlo o leerlo con su maquetación, descargue el PDF.
Descargar en PDF