II Jornada sobre el sistema público de pensiones y seguridad social
NDC Benchmarking of Spanish Pensions: Disability, Survivor Reversibility and Hidden Redistribution
AHMED ACIÓN LÓPEZ CARLOS VIDAL-MELIÁ
Estudios sobre la Economía Española 2026/29 Septiembre 2026
fedea
Las opiniones recogidas en este documento son las de sus autores y no coinciden necesariamente con las de Fedea.
* Este trabajo forma parte de un proyecto de investigación financiado parcialmente por la Fundación Ramón Areces
Ahmed Ación López
Department of Economics and Law, University of Cassino and Southern Lazio, Cassino, Italy. (e-mail: ahmed.acionlopez@unicas.it). ORCID: 0000-0001-9211-0909.
Carlos Vidal-Meliá (corresponding author)
Department of Financial Economics and Actuarial Science and Instituto Universitario de Derecho Patrimonial – Patrimonium, University of Valencia, Valencia, Spain. (email: carlos.vidal@uv.es). ORCID: 0000-0002-7227-5076.
Abstract
We develop an actuarially grounded NDC counterfactual to benchmark Spain’s pay-asyou-go defined-benefit pension system. Using MCVL administrative microdata for 2015– 2023, we reconstruct individual notional capital from contribution histories and compare it with the actuarial cost of DB entitlements for retirement, disability and survivorcontingent reversibility. Italy’s NDC experience serves as an institutional reference highlighting the need for explicit treatment of non-old-age contingencies. DB costs generally exceed NDC capital, revealing implicit transfers not captured in retirement-only assessments. Disability generates the largest deviations, while survivor reversibility adds contingent liabilities. Results support distinguishing contribution-based entitlements, contingent liabilities and redistributive effects.
JEL Classification: H55, J26, G22, I13, I38, J14
Keywords: Disability pensions; Internal rate of return; Money’s-worth ratio; Notional Defined Contribution; Survivor reversibility.
Acknowledgments
We would like to express our deepest gratitude to Professor Juan Manuel Pérez-Salamero (now retired), who generously provided the initial datasets from the Continuous Sample of Working Lives (MCVL). Without his support, this research would not have been possible. The authors are also grateful to Itziar Alberdi Garriga, Ignacio Fernández-Huertas Moraga, and Carolina Mateos Bustamante from the Spanish Independent Authority for Fiscal Responsibility (AIReF) for their valuable insights shared during the event “The Sustainability of Public Finances and the Pension System in Spain,” held on February 6, 2025. Their contributions were crucial in shaping the development of this study.
Declarations
Conflict of Interest: The authors declare no competing interests.
Funding: This research was supported by the Generalitat Valenciana, a regional government in Spain (PROMETEO 2025 program for excellence research groups, project CIPROM/2024/075).
Data Availability Statement: The Continuous Sample of Working Lives (MCVL) is an anonymized administrative dataset whose use for scientific purposes is regulated since its inception. Researchers may request access to specific versions of the MCVL by post. Each request must include a user profile describing the project and a signed document accepting the MCVL conditions of use. Detailed information is available at:
http://www.segsocial.es/wps/portal/wss/internet/EstadisticasPresupuestosEstudios/Estadisticas/EST211
The simulation code and additional data are available from the authors upon reasonable request.
Ethics Approval: Not applicable.
Declaration of generative AI and AI-assisted technologies in the writing process: The authors used ChatGPT and Abacus.AI (ChatLLM Teams) for language editing and assistance in building R analysis pipelines. All outputs were reviewed and validated by the authors, who assumed full responsibility for the content of this manuscript.
NDC Benchmarking of Spanish Pensions: Disability, Survivor Reversibility and Hidden Redistribution
1. Introduction
Spain's public pension system operates predominantly as a pay-as-you-go (PAYG) defined-benefit (DB) scheme. Like many mature pension systems, it faces growing pressure from population ageing, slower economic growth and the legacy generosity of benefit formulas. Recent estimates suggest that accrued pension liabilities increased substantially between 2015 and 2021, intensifying concerns about the system's long-term solvency and fiscal transparency (Castañer et al., 2025). Recent reforms, including the reintroduction of indexation to the Consumer Price Index (CPI), the repeal of the sustainability factor, incentives for delayed retirement and larger Treasury transfers, have sought to stabilize the system. However, independent assessments continue to question whether these parametric measures are sufficient to address the structural imbalance between contributions and expected benefits (AIReF, 2023; De la Fuente et al., 2023; García-Díaz, 2023). In fact, recent macroeconomic modelling warns that the latest changes could prove counterproductive by failing to improve sustainability while reducing the welfare of high earners through increased payroll taxes. These findings suggest that further pension reforms are likely to remain on the policy agenda (Díaz-Giménez & Díaz-Saavedra, 2026).
A central limitation of many pension assessments is that they focus primarily on old-age retirement benefits (AIReF, 2025; Villanueva-García et al., 2025), while non-retirement contingencies are treated more aggregately or left outside the main actuarial comparison. However, the cost of a contributory pension system is shaped not only by ordinary retirement pensions, but also by disability pensions, survivor reversibility and subgroupspecific mortality. Omitting or simplifying these elements may understate both the value of pension promises and the distributional incidence of transfers embedded in contributory formulas.
In parallel, the international literature has increasingly explored implicit transfers, social security wealth, and internal rates of return (Belloni et al., 2020; Rose et al., 2024a, 2024b; Groenewoud & Ponds, 2025). Nevertheless, these studies often face data and design limitations: they frequently rely on survey data rather than administrative records and examine hypothetical rather than observed workers. Furthermore, a related strand emphasizes that such distributional estimates are highly sensitive to mortality assumptions (Haan et al., 2020; Vidal-Meliá et al., 2025).
This paper addresses this limitation by developing an actuarially grounded Notional Defined Contribution (NDC) counterfactual as a transparency benchmark for Spain’s DB pension system. The purpose is not to simulate an immediate replacement of the Spanish DB scheme, but to provide a contribution-based actuarial reference against which the cost, incidence and visibility of implicit redistribution can be assessed. Observed contribution histories are used to reconstruct the notional capital that individuals would have accumulated under a stylized NDC rule, which is then compared with the actuarial cost of observed DB pension entitlements. The assessment is summarized through three actuarial indicators: the notional-cost gap, the money’s-worth ratio (MWR) and the real internal rate of return (IRR). The empirical analysis uses administrative microdata from the Continuous Sample of Working Lives (Muestra Continua de Vidas Laborales, MCVL) for cohorts entering retirement or disability between 2015 and 2023.
Italy provides a useful institutional reference because its NDC architecture links benefits to capitalized lifetime contributions and age-specific transformation coefficients. However, disability and survivor benefits remain governed by distinct design rules that are not fully integrated into the NDC logic. This case illustrates the limitations of extending NDC principles beyond old-age pensions without an explicit actuarial treatment of disability and survivor contingencies.
Against this background, the paper addresses three research questions. First, how does the actuarial cost of Spain’s observed DB pension entitlements compare with the notional capital accumulated under a pure NDC benchmark that jointly accounts for retirement, disability, and survivor benefits? Second, which groups concentrate the largest actuarial gaps, MWRs and IRRs by sex, career length, cohort and contingency? Third, how much does the diagnosis of actuarial imbalance change when disability pensions and survivor reversibility are explicitly incorporated rather than treating retirement pensions in isolation?
To our knowledge, we are not aware of any previous country-level DB-NDC benchmarking exercise that combines reconstructed notional capital, observed DB pension flows, contingency-specific mortality assumptions, disability pensions and survivor-contingent liabilities within a single empirical valuation. This paper provides such an exercise for Spain. The contribution is not to introduce new actuarial indicators, but to apply existing measures jointly to contingencies that are often analysed separately or simplified in aggregate pension assessments.
After this introduction, Section 2 presents the methodology, data and actuarial assumptions used to construct the NDC benchmark and value DB pension entitlements. Section 3 reports the empirical results by contingency, sex, contribution history and survivor scenario. Section 4 discusses the implications for actuarial monitoring, fiscal transparency, redistribution and pension design. Section 5 concludes. Appendix A reports the formal valuation framework, Appendix B presents the disability-specific mortality assumptions and Appendix C formalizes the Italian NDC reference cases. The paper is accompanied by Supplementary Material that provides the full distributional tables underlying the empirical analysis. These include summary statistics (minima, quartiles, medians, means and maxima) by cohort, sex and survivor-reversibility scenario, as well as disability results by severity grade and representative low and high MWR profiles.
2. Data, Assumptions and Actuarial Benchmarking Strategy
This section outlines the empirical framework and valuation procedures used to address the paper’s main research questions. The benchmark is constructed in three steps. First, individual contribution histories observed in the MCVL are used to reconstruct the notional capital accumulated under the counterfactual NDC rule. Second, the actuarial present value of retirement and disability pension entitlements is computed, both without and with survivor reversibility. Third, the difference between NDC capital and DB pension cost is summarized through three indicators.
2.1. Benchmarking Logic
NDC systems are PAYG schemes that record contributions in individual notional accounts and convert accumulated notional capital into an annuity using actuarial conversion factors. Their central actuarial logic is to link pension entitlements to lifetime contributions while adjusting benefits to demographic and macroeconomic conditions (Holzmann, 2017).
The benchmark is deliberately stylized. It credits observed contributions, capitalizes them according to a macroeconomic notional return rule, and values benefits using mortality assumptions matched to the relevant contingency and subgroup. It is not intended to reproduce every legal feature of an actual NDC reform, but to identify where observed DB pension promises exceed, match or fall short of contribution-based actuarial capital.
The comparison focuses on three contributory components: retirement pensions, disability pensions and survivor reversibility generated by the death of a retirement or disability pensioner. These components are analysed jointly because they are not actuarially independent modules. Disability changes the timing and expected duration of pension payments, while survivor reversibility converts an individual pension promise into a contingent family benefit.
The benchmark should not be read as treating redistribution as undesirable. It separates actuarial balance, fiscal transparency and pension adequacy as distinct dimensions of pension assessment.
2.2. Data and Sample Construction
The empirical analysis uses the Continuous Sample of Working Lives (Muestra Continua de Vidas Laborales, MCVL), a longitudinal administrative dataset drawn from Spanish Social Security records. The MCVL provides individual-level information on employment histories, contribution bases, demographic characteristics, contractual arrangements and pension records. Its representativeness and usefulness for pension analysis has been documented by Pérez-Salamero et al. (2017). The analysis covers 2015- 2023 and focuses on individuals entering retirement or disability during those years.
Table 1 reports the final analytic sample used in the DB-NDC benchmarking exercise. The sample contains 31,382 pension observations across the 2015-2023 entry cohorts: 4,659 retirement pensioners and 26,723 disability pensioners. Full distributional statistics and reference denominators for these cells are reported in the Supplementary Material. Tables R1-R8 cover retirement pensioners by sex and survivor-reversibility scenario, while Tables D1-D16 cover disability pensioners by sex, disability grade and survivorreversibility scenario.
Table 1. Analytic sample by cohort, contingency and sex, 2015-2023
| Cohort | Retirement | Disability | Total | ||||
| Women | Men | Total | Women | Men | Total | ||
| 2015 | 269 | 260 | 529 | 1,184 | 2,035 | 3,219 | 3,748 |
| 2016 | 261 | 270 | 531 | 1,277 | 2,012 | 3,289 | 3,820 |
| 2017 | 265 | 275 | 540 | 1,151 | 1,882 | 3,033 | 3,573 |
| 2018 | 316 | 321 | 637 | 1,248 | 1,755 | 3,003 | 3,640 |
| 2019 | 185 | 296 | 481 | 1,282 | 1,811 | 3,093 | 3,574 |
| 2020 | 185 | 321 | 506 | 1,035 | 1,454 | 2,489 | 2,995 |
| 2021 | 165 | 315 | 480 | 1,129 | 1,791 | 2,920 | 3,400 |
| 2022 | 198 | 268 | 466 | 1,095 | 1,701 | 2,796 | 3,262 |
| 2023 | 190 | 299 | 489 | 1,126 | 1,755 | 2,881 | 3,370 |
| Total | 2,034 | 2,625 | 4,659 | 10,527 | 16,196 | 26,723 | 31,382 |
Source: Own elaboration Note: Counts correspond to the final analytic cells used for the actuarial indicators.
The empirical sample is restricted to records for which accumulated notional capital can be reconstructed from observed contribution bases. This restriction is especially relevant for retirement pensions, where reported or credited contribution months do not always match the contribution bases effectively observed in the MCVL. In microsimulation exercises, missing monthly contribution-base records may be completed using statutory minimum bases or related imputation procedures (AIReF, 2025). Such imputations are useful when approximating the DB regulatory base, but they do not correspond to contributions actually observed in the administrative record. Because the NDC counterfactual is contribution-based by construction, the benchmark retains only cases for which observed contribution bases can be consistently matched to the contribution history. Disability records are much less affected by this restriction, and almost all disability pension-entry records remain usable for the actuarial calculations.
2.3. Actuarial and Economic Assumptions
The assumptions are organized in three blocks. First, financial and economic assumptions determine the notional return used to accumulate contributions and the discount and indexation rates used to value DB pension payments. Second, contribution-rate assumptions define the capital accumulated under the NDC counterfactual. Third, biometric assumptions determine the expected duration of retirement, disability and survivor benefits.
Contributions in the NDC counterfactual are capitalized using a macroeconomic notional return equal to the geometric average of nominal GDP growth over the five years preceding each year of application. This rule smooths short-term macroeconomic volatility while preserving the link between notional accumulation and observed economic performance. Although inspired by the Italian NDC framework, the benchmark does not impose a floor during recessions to avoid negative notional rates, preserving the actuarial transparency (European Commission, 2024; Geroldi et al., 2025).
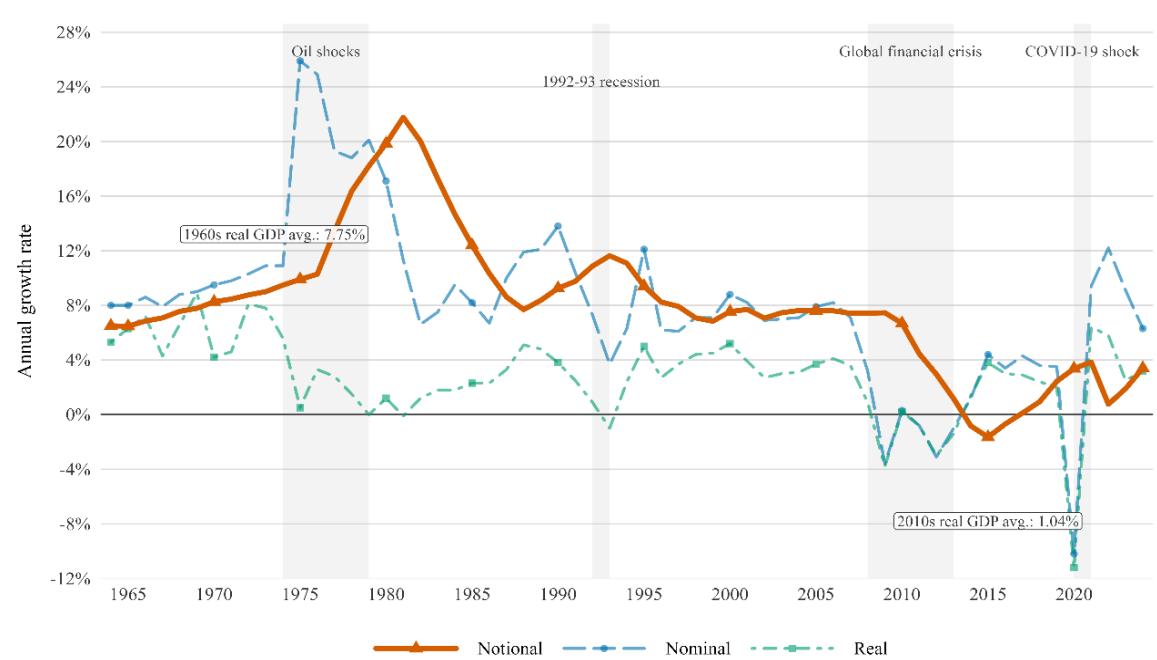
Figure 1 shows the long-run evolution of GDP growth in Spain. The decline in real GDP growth across successive decades is relevant for a PAYG pension system because it affects both the financing capacity of the system and the capitalized value of contributionbased pension rights. By linking notional accumulation to GDP growth, the benchmark makes this macroeconomic constraint explicit.
Figure 1: Annual GDP growth rates in Spain (1964–2024). Source: Datosmacro.com; authors’ calculations.
The actuarial valuation of DB entitlements uses the financial and indexation assumptions reported in Table 2. The nominal discount rate is based on the 27-year geometric average of real GDP growth and inflation. This horizon corresponds to the average system maturation period used in actuarial analyses of the Spanish pension system and reflects the lag between contributions and pension entitlements (Garvey et al., 2023; Castañer et al., 2025). Pension indexation is derived using the same historical window. Real discount, real indexation and real actuarial discount rates are then obtained by adjusting for inflation and pension revaluation.
Table 2. Financial and economic assumptions, 2015–2023 Source: Own elaboration
| Assumption (%) | 2015 | 2016 | 2017 | 2018 | 2019 | 2020 | 2021 | 2022 | 2023 |
| Nominal discount rate (i) | 4.45 | 4.30 | 4.25 | 4.18 | 4.87 | 4.70 | 4.58 | 4.03 | 4.23 |
| Nominal indexation rate (λ) | 4.03 | 3.88 | 4.00 | 3.64 | 3.30 | 3.06 | 3.01 | 2.86 | 2.73 |
| Inflation rate (π) | 3.53 | 3.31 | 3.10 | 2.90 | 2.71 | 2.55 | 2.38 | 2.26 | 2.31 |
| Real discount rate (i*) | 0.89 | 0.95 | 1.12 | 1.24 | 2.11 | 2.10 | 2.14 | 1.73 | 1.88 |
| Real indexation rate (λ*) | 0.48 | 0.55 | 0.87 | 0.72 | 0.57 | 0.50 | 0.62 | 0.59 | 0.41 |
| Real actuarial discount rate (ia*) | 0.41 | 0.40 | 0.24 | 0.52 | 1.52 | 1.60 | 1.52 | 1.14 | 1.46 |
This historical-data approach follows the stability and transparency principles recommended by Eurostat (2020). It also avoids relying directly on long-term macroeconomic projections, which may introduce forecast errors or optimistic biases in public-sector pension valuation (O’Brien & Zaranko, 2023; Morikawa, 2022).
Table 3 reports the contribution-rate, notional-return and biometric assumptions used in the benchmark. The benchmark uses unified contribution rates (CR) to avoid introducing year-specific contribution-rate variation into the NDC counterfactual. These rates are derived from the 2002-2024 pension-payroll distribution for the General Regime and the self-employed regime combined. Retirement and permanent disability account for 80.48% of total contributory pension payroll, rising to 98.36% when widowhood pensions are also included. Applying the common contribution rate (28.30%) to these shares gives 22.78% and 27.83%, respectively.
Table 3. Contribution rates, notional return and biometric assumptions
| Item | Assumption |
| CR retirement and disability | 22.78% |
| CR retirement, disability and survivors | 27.83% |
| Notional rate for contributions | Geometric average of the nominal GDP growth rates observed in the five years preceding the year of application. See Figure 1. |
| Mortality basis: retirement and survivors | Income-quartile life tables. Own elaboration from Vidal-Meliá et al. (2025). |
| Mortality basis: disability | Severity- and onset-specific life tables. Own elaboration; see Appendix B. |
| Mortality basis: survivors of pensioners with disabilities | General-population life tables, INE. |
| Source: Own elaboration | |
Mortality assumptions are central to the benchmark because they determine the expected duration of pension payments and survivor-contingent liabilities. Retirement pensions and survivor reversibility are valued using mortality tables differentiated by sex and pension-income group, based on refined estimates for Spanish pensioners aged 65 and over (Vidal-Meliá et al., 2025).
Table 4 reports life expectancy at selected ages by pension-income group and sex, alongside general-population estimates from the Spanish National Statistics Institute (Instituto Nacional de Estadísticas, INE), revealing two patterns for the valuation. First, there is a clear within-sex longevity gradient by pension amount: at age 65, life expectancy differs by 2.68 years between G1F and G4F and by 2.83 years between G1M and G4M. Second, sex differences are large enough to dominate part of the pensionincome gradient: women in the lowest pension-income group have higher life expectancy than men in the highest pension-income group at the same age. Pensioner mortality also differs from general-population mortality, as AF and AM exceed INEF and INEM, respectively. These patterns justify using subgroup-specific mortality rather than aggregate population tables. Where younger-age rates are required, subgroup-to-generalpopulation mortality ratios are extrapolated in a controlled way to avoid implausible age patterns, using INE general-population information as a complement.
For disability pensions, mortality is adjusted by severity level, sex and age at disability onset, reflecting the systematically shorter life expectancies documented for disability pensioners (Maleh & Bosley, 2024; Duran et al., 2016; Serra-Saurina et al., 2021). The construction of these assumptions is documented in Appendix B.
In the empirical results, disability severity is reported as G1, G2 and G3, corresponding to the main Spanish Social Security degrees of permanent incapacity: permanent total incapacity for the usual occupation, permanent absolute incapacity for any work, and severe incapacity requiring assistance from another person for essential activities of daily living. These categories align the actuarial mortality adjustment with the legal structure of disability pensions (Real Decreto Legislativo 8/2015; Seguridad Social, 2025).
Table 4: Life expectancy (in years) at several ages for selected pension income groups (2016-2021)
| Age | G1F | G2F | G3F | G4F | AF | INEF | G4F-G1F | AF-INEF |
| 55 | 33.85 | 35.13 | 35.83 | 36.53 | 35.50 | 31.93 | 2.68 | 3.57 |
| 65 | 24.36 | 25.55 | 26.24 | 27.04 | 25.91 | 22.90 | 2.68 | 3.01 |
| 75 | 15.48 | 16.45 | 17.12 | 18.02 | 16.78 | 14.37 | 2.54 | 2.41 |
| 85 | 8.40 | 8.78 | 9.29 | 10.31 | 9.01 | 7.29 | 1.91 | 1.72 |
| Age | G1M | G2M | G3M | G4M | AM | INEM | G4M-G1M | AM-INEM |
| 55 | 28.65 | 30.34 | 31.31 | 32.31 | 30.85 | 27.71 | 3.66 | 3.14 |
| 65 | 20.25 | 21.50 | 22.26 | 23.08 | 21.89 | 19.49 | 2.83 | 2.40 |
| 75 | 12.98 | 13.66 | 14.12 | 14.68 | 13.90 | 12.29 | 1.70 | 1.61 |
| 85 | 7.32 | 7.50 | 7.62 | 7.75 | 7.56 | 6.62 | 0.43 | 0.95 |
Source: Own elaboration based on MCVL (2016-2021) and INE (2016-2021) Note: G1–G4 denote pension-income groups ordered from lowest to highest pension benefit amount; F denotes female pensioners and M denotes male pensioners. AF and AM denote average life expectancy for female and male pensioners in the sample. INEF and INEM denote female and male general-population life expectancy from INE. G4F–G1F and G4M–G1M measure the within-sex longevity gradient between the highest and lowest pension-income groups.
Survivor reversibility is valued using standardized beneficiary profiles. Male pensioners are assumed to have spouses three years younger, and female pensioners spouses three years older. For survivor benefits derived from disability pensions, survivor mortality is based on general-population INE tables. These assumptions allow survivor liabilities to be incorporated consistently across cohorts, sex and contingency groups.
As a robustness check on the biometric basis, the Supplementary Material reports alternative valuations using INE mortality tables. These variants allow the benchmark results based on subgroup-specific pensioner mortality and disability-specific mortality to be compared with valuations based on general-population mortality.
2.4. Valuing NDC Capital and DB Pension Liabilities
The benchmark compares two capital measures for each individual: notional capital and the actuarial cost of the observed DB pension entitlement. The formal equations used to compute these measures are reported in Appendix A.
2.4.1. Notional Capital Under the NDC Counterfactual
Notional capital is obtained by crediting observed contribution bases under the benchmark contribution rate and capitalizing them with the notional return rule described in Section 2.3. This measure is contribution-based by construction (see Section 2.2 on the exclusion of statutory contribution-gap imputations).
For retirement pensions, accumulated notional capital is converted into a benchmark pension using an actuarial conversion coefficient based on the relevant annuity divisor. For disability pensions, the same logic is applied at disability onset, but the annuity divisor is adjusted by severity, sex and age at onset to reflect disability-specific mortality. The benchmark therefore treats disability as a distinct actuarial contingency rather than as ordinary retirement valued with general-population mortality. This treatment is consistent with previous work on integrating retirement and permanent disability within NDC pension schemes, which emphasizes that disability requires specific actuarial treatment rather than valuation through ordinary retirement coefficients (Ventura-Marco & Vidal-Meliá, 2016).
This specification differs from the Italian NDC reference case formalized in Appendix C. Unlike the Italian disability formula, the benchmark does not include notional contribution credits after disability onset or any extension of the contributory record up to statutory retirement age (Geroldi et al., 2025). At the same time, disability-specific annuity divisors avoid the regressive valuation effects that may arise when disabled individuals are assigned uniform conversion coefficients based on general-population mortality (Gronchi et al., 2023).
2.4.2. Capital Cost of Spanish DB Pensions
The actuarial cost of observed Spanish DB pensions is defined as the present value of the expected pension stream recorded in the MCVL. The valuation uses the initial monthly pension amount and the Spanish payment structure of twelve-monthly payments plus two additional payments. It also applies the financial and indexation assumptions described in Section 2.3, and mortality assumptions matched to the relevant contingency and subgroup.
This capital-cost measure is computed for retirement and disability pensions, with and without survivor reversibility. It is then compared with NDC capital to identify the extent to which observed DB pension promises exceed, match or fall short of this contributionbased actuarial capital.
2.4.3. Survivor Reversibility
Survivor reversibility is valued by replacing the single-life annuity factor with a survivorcontingent annuity factor. The central scenario applies the ordinary Spanish widowhood percentage of 52 %, while the Supplementary Material reports an additional 70% survivor-fraction sensitivity. The formal survivor-contingent annuity expression is reported in Appendix A.
The empirical survivor component analysed in this paper is reversibility attached to retirement and disability pensions. This approach makes the actuarial cost of the survivor component directly observable instead of treating it as an implicit or average element of the pension formula. This issue is also present in the Italian NDC reference case, where survivor benefits are incorporated through common parameters and statutory replacement fractions rather than through individualized survivor-contingent valuation (Caselli & Lipsi, 2019; Gronchi et al., 2023; Appendix C).
Survivor pensions triggered by the death of active contributors are not included in the empirical analysis because the linked contribution history of the deceased insured person is not observed in the data.
2.5. Measuring Actuarial Imbalance: Notional-Cost Gap, MWRs and IRRs
The comparison between notional capital and DB capital cost is summarized through three indicators: the notional-cost gap, the money’s-worth ratio (MWR) and the real internal rate of return (IRR). Their formal definitions are reported in Appendix A.
The notional-cost gap is measured as estimated NDC capital minus the actuarial cost of the observed DB pension. A negative gap indicates that the actuarial cost of the DB entitlement exceeds the contribution-based capital accumulated under the benchmark, implying actuarial gains relative to contributions. A positive gap indicates the opposite, implying actuarial losses relative to contributions.
MWRs are widely used to assess the actuarial value of pension benefits relative to contributions and provide a compact measure of implicit redistribution (Rose et al., 2024b). An MWR above one indicates that expected DB benefits exceed the contributionbased benchmark; an MWR below one indicates that the DB entitlement is less valuable than reconstructed NDC capital.
The real IRR measures the discount rate that equalizes accumulated contributions and expected DB pension payments. IRRs provide a return-based measure of the generosity of the pension formula relative to contribution histories (Rose et al., 2024a). In this paper, the IRR is computed using the same mortality, indexation and payment-frequency assumptions as the DB capital-cost valuation.
The notional-cost gap, MWR and IRR should be interpreted as measures of actuarial return relative to observed contributions. They do not measure pension adequacy, poverty protection or the social desirability of redistribution. A group may receive a high actuarial return while still receiving low pension income in absolute terms. This distinction is particularly important when interpreting results by sex, disability status and career length.
3. Results
This section presents the main results of the DB-NDC benchmarking exercise for cohorts between 2015 and 2023. The analysis reports NDC capital, actuarial DB capital cost, the notional-cost gap, the money’s-worth ratio (MWR) and the real internal rate of return (IRR). Results are disaggregated by contingency, sex, cohort and survivor scenario.
Table 5. Summary of median actuarial indicators by contingency, sex, benchmark scenario and survivor valuation, selected cohorts
| Cohort | Contingency | Sex | Survivor scenario | NDC | DB cost | Gap | MWR | IRR% |
| 2015 | Retirement | W | No | 84,926 | 178,239 | -96,950 | 2.080 | 7.46 |
| M | No | 173,154 | 197,561 | -49,963 | 1.370 | 3.24 | ||
| W | NB | 103,753 | 178,239 | -76,714 | 1.700 | 5.20 | ||
| M | NB | 211,540 | 197,561 | -18,093 | 1.120 | 1.29 | ||
| W | 52% | 103,753 | 187,579 | -86,089 | 1.776 | 5.61 | ||
| M | 52% | 211,540 | 241,614 | -61,949 | 1.372 | 2.88 | ||
| Disability | W | No | 66,663 | 267,033 | -190,818 | 3.890 | 14.60 | |
| M | No | 118,923 | 276,142 | -141,240 | 2.176 | 8.81 | ||
| W | NB | 81,441 | 267,033 | -169,735 | 3.184 | 11.53 | ||
| M | NB | 145,287 | 276,142 | -111,987 | 1.781 | 6.85 | ||
| W | 52% | 81,441 | 281,113 | -183,401 | 3.349 | 11.80 | ||
| M | 52% | 145,287 | 345,077 | -185,359 | 2.276 | 7.57 | ||
| 2019 | Retirement | W | No | 106,242 | 184,802 | -90,083 | 1.860 | 7.56 |
| M | No | 166,257 | 174,708 | -33,842 | 1.220 | 3.39 | ||
| W | NB | 129,795 | 184,802 | -70,118 | 1.520 | 5.32 | ||
| M | NB | 203,113 | 174,708 | 753 | 0.995 | 1.36 | ||
| W | 52% | 129,795 | 192,179 | -78,178 | 1.580 | 5.73 | ||
| M | 52% | 203,113 | 212,836 | -35,777 | 1.210 | 3.08 | ||
| Disability | W | No | 68,143 | 232,489 | -148,860 | 3.590 | 15.97 | |
| M | No | 112,642 | 225,655 | -113,085 | 2.020 | 9.64 | ||
| W | NB | 83,249 | 232,489 | -151,418 | 2.934 | 12.78 | ||
| M | NB | 137,613 | 225,655 | -89,827 | 1.655 | 7.17 | ||
| W | 52% | 83,249 | 242,506 | -162,300 | 3.076 | 12.97 | ||
| M | 52% | 137,613 | 273,122 | -138,684 | 2.019 | 8.19 | ||
| 2023 | Retirement | W | No | 127,414 | 225,812 | -103,573 | 1.710 | 6.57 |
| M | No | 190,310 | 203,225 | -50,092 | 1.280 | 3.73 | ||
| W | NB | 155,660 | 225,812 | -70,265 | 1.402 | 4.42 | ||
| M | NB | 232,499 | 203,225 | -12,188 | 1.048 | 1.67 | ||
| W | 52% | 155,660 | 234,956 | -81,011 | 1.466 | 4.79 | ||
| M | 52% | 232,499 | 246,376 | -55,844 | 1.267 | 3.28 | ||
| Disability | W | No | 78,011 | 267,966 | -188,825 | 3.477 | 15.39 | |
| M | No | 123,826 | 257,965 | -131,441 | 2.109 | 9.82 | ||
| W | NB | 95,304 | 267,966 | -171,579 | 2.846 | 12.23 | ||
| M | NB | 151,276 | 257,965 | -104,789 | 1.726 | 7.27 | ||
| W | 52% | 95,304 | 279,424 | -184,159 | 2.993 | 12.50 | ||
| M | 52% | 151,276 | 309,284 | -159,262 | 2.088 | 8.30 |
Source: Own elaboration Note: W denotes women and M denotes men. NDC and DB cost are reported in euros. The full distributional source tables underlying these selected medians are reported in the Supplementary Material.
It is worth highlighting that all indicators are medians of individual-level variables, so the median gap and median MWR are not necessarily equal to the difference or ratio between the displayed median NDC capital and DB cost. Median values are used throughout the main tables to reduce the influence of extreme observations. The “No” scenario excludes survivor coverage and reconstructs NDC capital using the contribution rate for retirement and disability only. The “NB” scenario uses the broader contribution rate covering retirement, disability and survivors, but values the DB pension as a single-life entitlement because no eligible survivor beneficiary is assumed. The “52%” scenario uses the same survivor-inclusive NDC capital as “NB” but adds the survivor-contingent DB liability using the ordinary Spanish widowhood percentage.
Three patterns organize the results summarized in Table 5. First, median DB capital costs generally exceed reconstructed NDC capital, although the size of the gap varies sharply by contingency, sex and benchmark scenario. The only near-exception is male retirees in the "NB" scenario (MWR of 0.995 in 2019 and 0.969 in 2021, i.e. NDC capital marginally above DB cost). Second, disability pensions show larger deviations from the benchmark than retirement pensions across all scenarios. Third, the distinction between “NB” and “52%” isolates the actuarial cost of survivor reversibility. Adding the survivor-contingent annuity increases DB capital costs and widens the gap, with a stronger effect for male pensioners under the standardized spouse-age assumptions.
3.1. Overview of Actuarial Imbalance
Table 6 complements the median results by showing the dispersion of MWRs across the full set of cohort-specific supplementary tables. This matters because the benchmark identifies not only average or median actuarial imbalance, but also the thickness of the tails generated by short contribution histories, early pension entry and survivorcontingent valuation. "Lowest cohort minimum" is the lowest minimum MWR observed across the 2015-2023 cohort tables in each group. "Cohort median range" and "Cohort Q3 range" report the minimum and maximum of the cohort-specific medians and third quartiles. "Highest cohort maximum" is the largest maximum MWR observed across cohort tables. Extreme maxima are tail observations and should not be interpreted as population averages. Finally, the last column identifies the specific cohort year in which this highest maximum MWR was observed.
Table 6. Distributional span of money's-worth ratios by contingency, sex and survivor scenario, 2015-2023. Source: Own elaboration
| Population | Sex | Scenario | Cohort | ||||
| Lowest Min | Median range | Q3 range | Highest Max | Of highest Max | |||
| Retirement | W | No | 0.15 | 1.71-2.21 | 2.05-3.26 | 29.11 | 2018 |
| M | No | 0.10 | 1.18-1.40 | 1.44-1.84 | 9.86 | 2017 | |
| W | 52% | 0.13 | 1.47-1.90 | 1.74-2.81 | 24.93 | 2018 | |
| M | 52% | 0.10 | 1.18-1.42 | 1.42-1.85 | 10.03 | 2017 | |
| Disability | W | No | 0.12 | 3.47-4.40 | 5.89-8.28 | 313.69 | 2015 |
| M | No | 0.15 | 1.90-2.27 | 3.38-4.25 | 998.80 | 2022 | |
| W | 52% | 0.11 | 2.97-3.80 | 5.02-7.04 | 263.85 | 2015 | |
| M | 52% | 0.15 | 1.90-2.37 | 3.27-4.27 | 924.29 | 2022 | |
The distributional evidence sharpens the interpretation of the median results. Retirement pensions contain both below-benchmark cases and high-MWR tail observations. Across cohorts, the lowest retirement MWR is close to 0.10-0.15, while the highest observed maximum reaches 29.11 for women and 9.86 for men in the no-survivor scenario. Disability pensions have substantially thicker upper tails. In the no-survivor scenario, the cohort-specific median MWR ranges from 3.47 to 4.40 for women and from 1.90 to 2.27 for men, but the highest observed maxima reach 313.69 and 998.80, respectively. The main conclusion is therefore not only that disability pensions have higher median actuarial returns, but that they also concentrate much more extreme deviations from the NDC benchmark.
Across these benchmark scenarios, two substantive patterns remain stable. Retirement pensions display more moderate deviations from the contribution-based benchmark, with men close to actuarial equivalence in some cohorts and women recording higher MWRs and IRRs. Disability pensions show larger gaps, reflecting shorter contribution histories, earlier benefit onset and the specific rules governing disability protection. The following subsections examine these patterns in turn.
3.2. Retirement versus Disability Pensions
The comparison between retirement and disability pensions first uses the “No” benchmark reported in Table 5, which excludes survivor coverage and reconstructs NDC capital using the contribution rate for retirement and disability only. Under this benchmark, retirement pensions display moderate deviations from the NDC reference. Women record median gaps of EUR -96,950 in 2015, EUR -90,083 in 2019 and EUR - 103,573 in 2023, with MWRs declining from 2.080 to 1.710. Men also show negative gaps, but remain closer to actuarial equivalence: their median retirement gap is EUR - 49,963 in 2015, EUR -33,842 in 2019 and EUR -50,092 in 2023, with MWRs between 1.220 and 1.370 across the selected cohorts.
This pattern reflects the stronger contributory link in ordinary retirement pensions. Retirees generally have longer observed contribution histories than disability pensioners, so NDC capital is higher and the distance between accumulated contributions and DB liabilities is smaller. The remaining gap reflects the interaction between DB benefit rules, indexation and mortality differences, rather than the absence of contributivity.
Disability pensions generate substantially larger deviations under the same “No” benchmark. In 2023, the median disability gap is EUR -188,825 for women, with an MWR of 3.477 and a real IRR of 15.39 percent. For men, the corresponding median gap is EUR -131,441, with an MWR of 2.109 and a real IRR of 9.82 percent. The same ranking appears in earlier cohorts: disability gaps exceed retirement gaps for both sexes in 2015, 2019 and 2023.
These disability gaps remain large even after applying disability-specific mortality assumptions. Shorter expected lifetimes reduce the actuarial value of disability pension payments relative to valuations based on general-population mortality. The persistence of large gaps therefore indicates that they are driven mainly by lower accumulated contributions, earlier pension entry, and the benefit rules associated with disability protection.
The severity breakdown reported in the Supplementary Material confirms that disability pensions are actuarially heterogeneous. In the 2023 “No” scenario, women’s MWR rises from 3.216 in grade 1 to 4.863 in grade 2 and 5.089 in grade 3, while the corresponding IRR increases from 14.03 percent to 22.00 percent and 27.13 percent. Among men, the MWR rises from 2.024 in grade 1 to 2.331 in grade 2 and 4.185 in grade 3, with IRRs of 8.89 percent, 12.48 percent and 25.12 percent.
The detailed grade-specific tables in the Supplementary Material also show that the most severe disability category is based on small subsamples in some cohorts. For example, among women, grade-3 disability contains 10 observations in 2022 and 19 observations in 2023; among men, the corresponding counts are 37 and 39. Extreme grade-3 MWRs and IRRs should therefore be interpreted as distributional evidence for a small highseverity subgroup rather than as stable point estimates for the whole disability population.
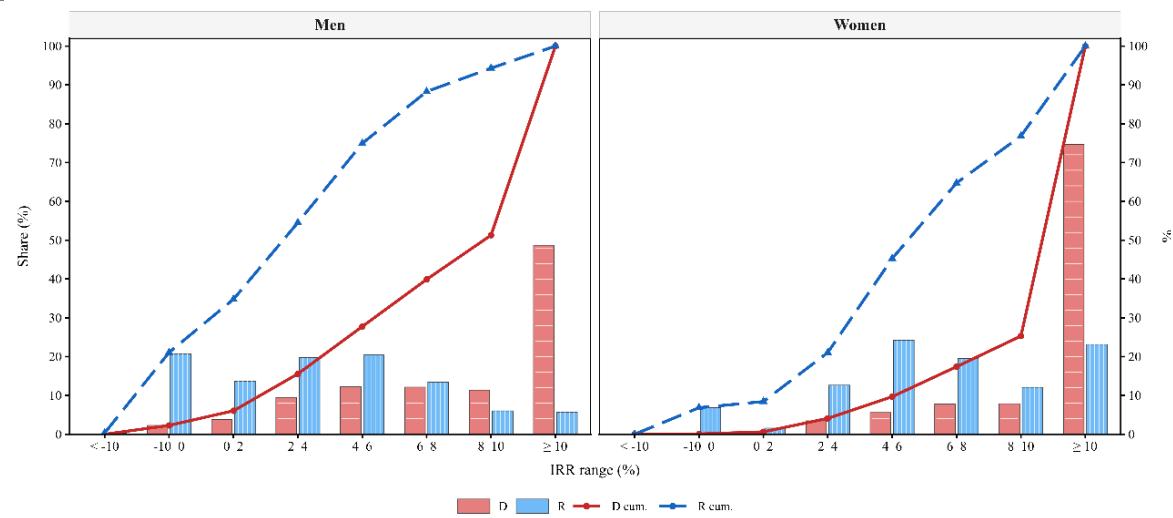
Figure 2 complements the median results by showing the distribution of real IRRs among retirement and disability pensioners in the 2023 cohort under the “No” benchmark.
Among men, 5.69 percent of retirees record a real IRR above 10 percent, compared with 48.72 percent of disability pensioners. Among women, the corresponding shares are 23.16 percent and 74.69 percent. Disability pensions therefore differ from retirement pensions not only in median values, but also in the thickness of the upper tail of actuarial returns.
Figure 2: IRR Ranges Among Retirement and Disability Pensioners (2023 Cohort, No Survivor Coverage) Source: Own elaboration
3.3. Survivor Coverage and Survivor Reversibility
Survivor reversibility enters the benchmark in two steps. The first step is on the contribution side: when survivor coverage is included in the benchmark, estimated NDC capital is calculated using the broader contribution rate for retirement, disability and survivors. This is the difference between the “No” and “NB” scenarios in Table 5. The second step is on the benefit side: among pensioners evaluated under the survivorinclusive contribution benchmark, the pension may be valued either as a single-life entitlement with no eligible beneficiary (“NB”) or as a survivor-contingent entitlement using the 52 percent widowhood percentage (“52%”).
The first step increases NDC capital and therefore reduces measured actuarial imbalance, holding the observed DB pension cost unchanged. In 2023, women’s median retirement NDC capital rises from EUR 127,414 in the “No” scenario to EUR 155,660 in the “NB” scenario, reducing the gap from EUR -103,573 to EUR -70,265 and the MWR from 1.710 to 1.402. For men, NDC capital rises from EUR 190,310 to EUR 232,499, narrowing the gap from EUR -50,092 to EUR -12,188 and reducing the MWR from 1.280 to 1.048. The same mechanism appears for disability pensions: under the survivor-inclusive contribution benchmark without an eligible beneficiary, the 2023 MWR falls from 3.477 to 2.846 for women and from 2.109 to 1.726 for men.
The second step isolates the actuarial cost of an eligible survivor beneficiary. Comparing “NB” with “52%”, in 2023 women’s median retirement gap widens from EUR -70,265 to EUR -81,011, and the MWR rises from 1.402 to 1.466. For men, the effect is larger: the median retirement gap moves from EUR -12,188 to EUR -55,844, while the MWR rises from 1.048 to 1.267. For disability pensions, the corresponding 2023 gap widens from EUR -171,579 to EUR -184,159 for women and from EUR -104,789 to EUR - 159,262 for men.
The stronger effect for men reflects the standardized beneficiary assumption used in the valuation: male pensioners are assumed to have spouses three years younger, which lengthens the expected survivor-payment period. The detailed annual results in the Supplementary Material show that this pattern is not confined to 2023. Distinguishing “No”, “NB” and “52%” scenarios is therefore essential: the movement from “No” to “NB” captures the financing-side effect of survivor coverage, while the movement from “NB” to “52%” captures the additional DB liability generated by survivor reversibility.
The Supplementary Material reports an additional 70% survivor-fraction scenario. The qualitative pattern is unchanged: moving from the no-beneficiary case to the 52% and 70% survivor fractions increases MWRs and real IRRs, with the largest proportional effect among male pensioners under the standardized spouse-age assumptions.
3.4. Sex Differences, Career Length and Redistributive Patterns
Sex differences remain a central feature of the results, but they should be interpreted as actuarial patterns rather than differences in pension income. Women generally record higher MWRs and IRRs than men because the DB formula interacts with longer female life expectancy and, in many cases, more fragmented contribution histories. In Table 5, women have higher retirement MWRs than men in each selected cohort and benchmark scenario. Under the “No” benchmark, the female-male MWR difference is 0.710 points in 2015, 0.640 points in 2019 and 0.430 points in 2023. The gap narrows over time, but it remains visible.
The same ordering appears when survivor coverage is incorporated. In the NB scenario, women’s retirement MWR exceeds men’s by 0.580 points in 2015, 0.525 points in 2019 and 0.354 points in 2023. Under the 52 percent survivor scenario, the corresponding differences are 0.404, 0.370 and 0.199 points. This narrowing reflects the stronger effect of survivor reversibility on men, as shown in Section 3.3, but it does not eliminate the underlying sex difference in actuarial returns.
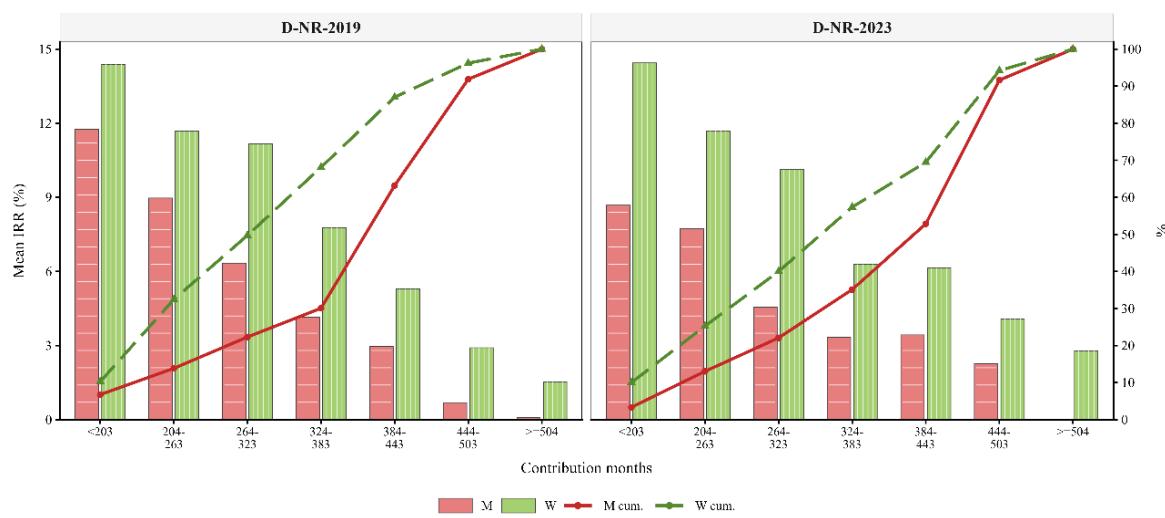
Career length provides a second redistributive dimension. Figure 3 plots IRRs against contribution months for male and female retirees in the 2019 and 2023 cohorts under the “No” benchmark. The relationship is negative: longer contribution careers are associated with lower actuarial returns, while shorter or interrupted careers tend to receive higher returns under the DB formula. This pattern is especially visible among women in the lower contribution ranges, where low accumulated notional capital combines with benefit rules that partly cushion incomplete careers.
The contribution-month gradient helps explain why sex differences in MWRs and IRRs should not be interpreted solely as a mortality effect. Longer female life expectancy increases the expected duration of pension payments, but fragmented careers and lower accumulated contribution capital also play an important role. The benchmark captures both mechanisms: the numerator reflects the actuarial value of the DB promise, while the denominator reflects the contribution-based capital.
The representative-profile tables in the Supplementary Material illustrate this mechanism at the tails of the retirement distribution. In the no-survivor scenario, the high-MWR female retirement profile in the 2018 cohort has 103 contribution months, notional capital of EUR 4,721 and a monthly pension of EUR 466.98, producing an MWR of 29.11. The corresponding high-MWR male profile in the 2017 cohort has 132 contribution months, notional capital of EUR 12,274 and a monthly pension of EUR 484.65, producing an MWR of 9.86. These are not typical observations, but they show why the upper tail is driven primarily by very low reconstructed notional capital rather than by unusually high monthly pensions.
Figure 3: Contribution Months and IRR: Men vs. Women, 2019 and 2023 Retirement Cohorts (No Survivor Benefits)
Source: Own elaboration
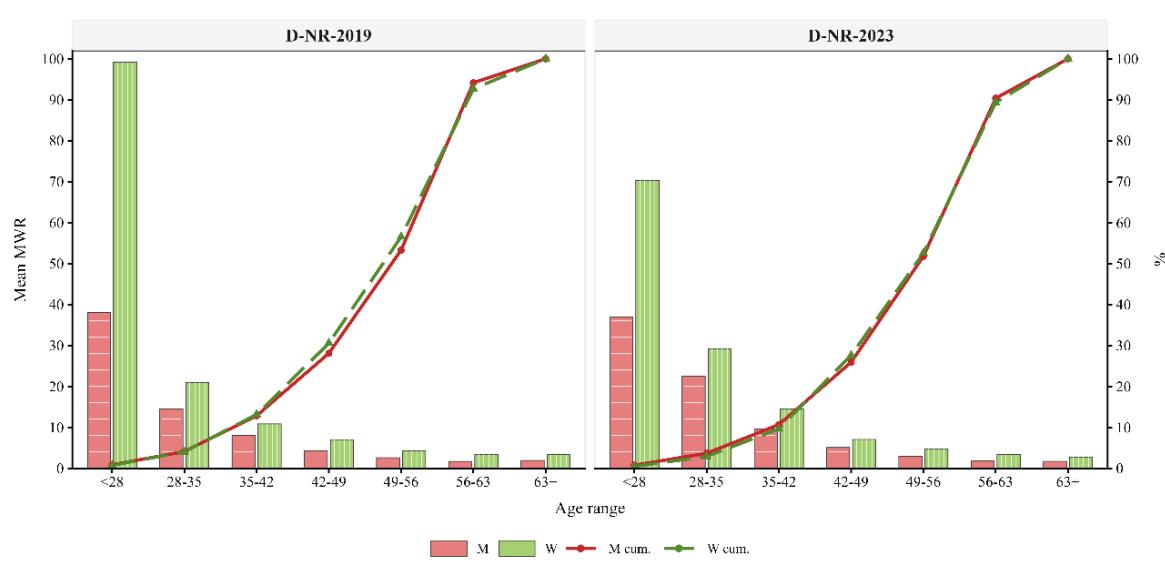
A related pattern appears within disability pensions. Figure 4 reports MWRs by age at disability claim for men and women in the 2019 and 2023 cohorts. Earlier disability onset is associated with higher MWRs because accumulated contributions are lower while the expected benefit stream begins earlier. This age-at-onset gradient complements the severity results reported in the Supplementary Material, showing that actuarial returns vary by severity, sex and timing of entry into disability.
The result is not a claim that disability benefits are excessive in a social-protection sense. It indicates that disability pensions concentrate a large part of the actuarial return measured relative to observed contribution histories.
Figure 4: MWR by Age at Disability Claim: Sex and Cohort Analysis (2019 & 2023)
Source: Own elaboration
3.5. Time Trends across Cohorts
Across cohorts, the benchmark points to persistence rather than convergence to actuarial equivalence. Under the “No” benchmark, women’s median retirement MWR declines from 2.080 in 2015 to 1.860 in 2019 and 1.710 in 2023, while men’s MWR remains lower, moving from 1.370 to 1.220 and then to 1.280. This suggests some moderation in women’s actuarial return relative to the benchmark, but not the disappearance of the gap between DB liabilities and NDC capital.
For disability pensions, the selected cohorts show larger and more persistent deviations. Under the “No” benchmark, women’s disability MWR moves from 3.890 in 2015 to 3.590 in 2019 and 3.477 in 2023. Men’s corresponding MWR moves from 2.176 to 2.020 and then to 2.109. Although these values fluctuate across cohorts, they remain well above the retirement benchmarks. The central time trend is therefore not a smooth convergence toward actuarial equivalence, but the continued separation between retirement and disability pensions in their distance from the NDC benchmark.
The survivor-related scenarios show a stable qualitative pattern across all cohorts, consistent with the two-step mechanism described in Section 3.3.
Taken together, the cohort evidence shows that the main results are not driven by a single year. Retirement pensions remain closer to the NDC benchmark than disability pensions, sex differences persist across cohorts, and survivor-related assumptions affect the diagnosis through distinct contribution-side and liability-side channels.
4. Discussion
4.1. Sustainability, Redistribution and the Limits of Retirement-Only Assessment
The results show that Spain’s DB pension promises are generally more costly than the contribution-based capital reconstructed under the NDC benchmark, but they also show that this imbalance is not a single object. Its size depends on the contingency considered, the mortality assumptions used, the contribution-rate benchmark and the treatment of survivor rights. The contribution of the benchmark is therefore not simply to show that DB costs exceed NDC capital, but to decompose the sources of that difference.
This decomposition matters for sustainability analysis. A retirement-only assessment would detect actuarial imbalance, especially among women and workers with shorter contribution histories, but it would miss two central components of the pension promise. First, disability pensions create larger deviations from the benchmark even after applying disability-specific mortality assumptions, and these deviations vary markedly by severity. Disability therefore cannot be treated as a homogeneous or residual contingency when assessing DB liabilities. Second, survivor coverage and survivor reversibility affect the benchmark through distinct channels. The transition from the “No” to the “NB” scenario increases notional capital by using the survivor-inclusive contribution rate, while the move from “NB” to “52%” increases DB liabilities by adding the survivor-contingent annuity.
This distinction also prevents a misallocation of contribution-based capital. Treating all contributions as if they financed only ordinary retirement would overstate the retirementonly notional capital and blur the financing role of survivor coverage. Conversely, valuing survivor rights only as an additional DB liability without identifying the corresponding contribution benchmark would mix financing-side and liability-side effects.
The persistence of these gaps also helps explain why parametric reforms may have limited effects on actuarial balance when they focus mainly on retirement rules. The reforms summarized in the Introduction affect important margins of old-age pension design, but the results for 2015-2023 suggest that disability pensions, survivor rights and subgroupspecific mortality remain central to the valuation of pension liabilities.
From a distributional perspective, high MWRs and IRRs among women, short-career workers and pensioners with disabilities indicate that the DB system redistributes toward groups with lower accumulated contributions, longer expected benefit duration, or both. These indicators measure relative generosity with respect to contributions rather than pension adequacy, and therefore do not imply higher retirement income. Women systematically exhibit higher actuarial returns than men, despite often receiving lower pensions due to shorter and more fragmented careers, lower average earnings and a higher incidence of part-time employment. The point is not that these transfers lack a social rationale. Disability protection, survivor benefits and the partial compensation of fragmented careers are legitimate objectives of a public pension system. Rather, the benchmark shows that these objectives are financed and delivered through mechanisms whose actuarial cost and distributional incidence are only partly visible.
The Italian NDC case, formalized in Appendix C, illustrates why this issue is not specific to Spain. Italy links old-age benefits to capitalized lifetime contributions and uses agespecific transformation coefficients, but disability and survivor benefits still require additional design choices. Belloni and Maccheroni (2013) discuss actuarial fairness in the Italian setting when longevity increases. Gronchi et al. (2023) show that NDC implementation becomes more complex once longevity heterogeneity, transformation coefficients and non-retirement contingencies are considered together. For survivor benefits, Caselli and Lipsi (2019) emphasize how heterogeneous longevity can generate redistribution that is not captured by uniform conversion rules. These studies support the interpretation adopted here: NDC principles are useful as a transparency benchmark, but disability and survivor benefits cannot be treated as simple extensions of old-age pension formulas.
The macroeconomic context reinforces the relevance of this decomposition. Spain’s longterm real GDP growth has weakened substantially over time. As shown in Figure 1, the geometric average of real GDP growth declined from 7.75 percent in the 1960s to 1.04 percent in the 2010s, with only a modest recovery to 1.12 percent in the first half of the 2020s. This slowdown reduces the capacity of a PAYG system to finance pension promises through wage-base expansion. Because the benchmark uses GDP-linked notional returns, slower growth is reflected directly in contribution-based capital. The same environment increases the importance of identifying which parts of DB liabilities are driven by contributory accrual, which by longevity and which by redistributive design.
4.2. Policy Implications
The results point to three policy implications. First, actuarial monitoring should integrate all major contributory contingencies. Pension oversight frameworks should value retirement pensions, disability pensions and survivor benefits within a unified structure. Treating retirement in isolation obscures actuarial links between contingencies and can lead to incomplete measurement of DB liabilities. It may also weaken reform diagnosis, because measures aimed only at retirement age, accrual rates or indexation do not show how liabilities are distributed across disability, survivor-contingent rights and ordinary retirement pensions.
Second, the financing of contributory entitlements and redistributive objectives should be made more transparent. Redistribution aimed at minimum income protection, care-related career gaps, disability protection or survivor protection may be socially desirable.
However, when these objectives are embedded inside contribution-based formulas, their cost and incidence become harder to evaluate. A clearer separation between contributionbased entitlements, insurance components and redistributive instruments would allow policymakers to preserve social adequacy while improving fiscal transparency.
Third, NDC principles can be used as a monitoring benchmark without implying a direct reform prescription. Bravo et al. (2023) show how retirement-age indexation can be linked to actuarial fairness when longevity increases. Hernæs et al. (2024) demonstrate, in the Norwegian case, that pension reform design can affect employment, retirement and disability insurance claims simultaneously. The Swedish Pensions Agency (TSPS, 2023) documents how transparent accounting and automatic adjustment rules can support the credibility of an NDC system. These experiences are useful for Spain not because they provide a ready-made model, but because they show the value of explicit accounting for demographic, economic and contingency-specific risks.
The policy message is therefore not to replace Spain’s DB system with a pure NDC scheme. It is to use NDC logic as a discipline for measuring where liabilities arise, where redistribution is concentrated and which parts of the pension promise should be financed transparently. Such an approach is compatible with targeted redistribution, provided that its objectives, costs and beneficiaries are made explicit.
4.3. Data Limitations and Scope of Analysis
The empirical scope of the analysis is shaped by the structure of the MCVL and by the need to preserve a strict observed-contribution interpretation of the NDC benchmark. The comparison is therefore restricted to records for which contribution histories can be approached with sufficient consistency. As discussed in Section 2.2, statutory contribution-gap imputations are excluded because they are legal devices for computing the regulatory base rather than contributions actually paid into the system.
A second boundary concerns survivor pensions. The analysis values survivor reversibility generated by the death of retirement and disability pensioners, but it does not include survivor pensions triggered by the death of active contributors. The MCVL does not provide the linked contribution history of the deceased insured person needed to reconstruct the corresponding notional capital. In addition, the valuation of reversibility relies on standardized beneficiary profiles because the actual age and sex of surviving spouses are not observed.
Finally, the valuation uses disaggregated mortality assumptions derived from recent observed mortality evidence, updated as new data become available, rather than explicit projections of future longevity improvements. This is consistent with the accounting principle of relying on verifiable facts and transactions at the date of valuation and with NDC practice in Sweden, where annuity divisors are based on recent official lifeexpectancy statistics (TSPS, 2023). Retirement pensions and survivor reversibility are valued using mortality tables differentiated by sex and pension-income group, while disability pensions incorporate adjustments by severity level and age at disability onset. The estimates should therefore be interpreted as conditional on the observed mortality basis and standardized survivor profiles used in the benchmark.
These limitations define the empirical perimeter of the exercise. They do not invalidate the comparison, but they indicate that the estimates should be interpreted as conditional on data availability, observed contribution histories, standardized survivor assumptions and mortality tables without explicit future longevity improvements.
A further interpretive boundary is that the main indicators are medians of individual-level variables. They identify the incidence and direction of actuarial imbalance across groups rather than aggregate pension liabilities. The full distributional evidence, including means, quartiles and extreme values, is reported in the Supplementary Material.
5. Conclusions and future research
This paper has used an actuarially grounded NDC counterfactual to benchmark Spain’s DB pension system using MCVL administrative microdata for 2015-2023. The exercise reconstructs individual notional capital from observed contribution histories and compares it with the actuarial cost of observed DB pension entitlements. Its purpose is diagnostic: NDC logic is used as a contribution-based reference for decomposing pension liabilities and implicit redistribution.
The results show that DB pension liabilities generally exceed NDC capital, but the size and interpretation of this deviation depend on the contingency and benchmark scenario considered. The general dominance of DB costs holds across contingencies and sexes, with the qualified exception of male retirees under the survivor-inclusive benchmark, who sit at or near actuarial equivalence. Retirement pensions display relevant but more moderate gaps, especially for men, whereas disability pensions generate much larger deviations even after applying disability-specific mortality assumptions. Within disability pensions, severity grades further shape MWRs and IRRs, confirming that disability should not be treated as a homogeneous contingency in pension valuation.
Survivor-related effects also need to be decomposed. Incorporating survivor coverage into the contribution benchmark increases NDC capital, while assigning an eligible survivor beneficiary increases the DB capital cost through the survivor-contingent annuity. Distinguishing these two steps clarifies why survivor rights affect the benchmark both through the contribution side and through the liability side. The liability effect is particularly visible for male pensioners under the standardized spouse-age assumptions.
The distributional patterns are uneven. Women, short-career workers and disability pension recipients tend to record higher MWRs and IRRs relative to observed contributions. The benchmark shows where implicit transfers arise, but it does not by itself determine whether those transfers are socially sufficient, excessive or optimally targeted.
The Italian NDC reference case reinforces this interpretation by showing that even systems based on notional accounts and transformation coefficients require explicit treatment of disability benefits, survivor pensions and heterogeneous mortality.
Overall, the paper shows that retirement-only monitoring gives an incomplete view of Spain’s DB pension promises. The value of the NDC benchmark lies in separating contribution-based capital, disability-related pension costs, survivor coverage, survivorcontingent liabilities and redistributive objectives. This separation does not resolve the policy trade-off between actuarial neutrality and social adequacy, but it makes that tradeoff more explicit.
Future research could extend the framework to survivor pensions triggered by the death of active contributors, incorporate richer household-level information on actual beneficiaries and introduce explicit longevity-improvement projections. These extensions would refine the measurement of contingent liabilities and household-level redistribution.
6. References
- Autoridad Independiente de Responsabilidad Fiscal (AIReF). (2023). Opinion on the long-term sustainability of public administrations: The impact of demographics. https://www.airef.es/en/centro-documental/opinion-on-the-long-term-sustainability-ofpublic-administrations-the-impact-of-demographics/
- Autoridad Independiente de Responsabilidad Fiscal (AIReF). (2025). Documento técnico 4/25: Suficiencia, equidad y contributividad del sistema de pensiones. Especial atención al impacto de la reforma 2021–2023. https://www.airef.es/es/centrodocumental/documentos-tecnicos/suficiencia-equidad-y-contributividad-del-sistema-depensiones-impacto-de-la-reforma-2021-2023/
- Belloni, M., & Maccheroni, C. (2013). Actuarial Fairness When Longevity Increases: An Evaluation of the Italian Pension System. The Geneva Papers on Risk and Insurance - Issues and Practice, 38(4), 638–674. https://doi.org/10.1057/gpp.2013.27
- Belloni, M., Brugiavini, A., Buia, R. E., Carrino, L., Cavapozzi, D., Orso, C. E., & Pasini, G. (2020). What do we learn about redistribution effects of pension systems from internationally comparable measures of social security wealth? Journal of Pension Economics & Finance, 19(4), 548–566. https://doi.org/10.1017/S1474747219000118
- Bravo, J. M., Ayuso, M., Holzmann, R., & Palmer, E. (2023). Intergenerational actuarial fairness when longevity increases: Amending the retirement age. Insurance: Mathematics and Economics, 113, 161–184. https://doi.org/10.1016/j.insmatheco.2023.08.007
- Caselli, G., & Lipsi, R. M. (2019). Survival inequalities and redistribution in the Italian pension system. Vienna Yearbook of Population Research, 1, 83–110. https://doi.org/10.1553/POPULATIONYEARBOOK2018S083
- Castañer, A., Garvey, A. M., Pérez-Salamero González, J. M., & Vidal-Meliá, C. (2025). Transforming Eurostat’s Table 29 into an actuarial balance sheet: A net worth approach to assessing public pension solvency. Journal of Risk and Financial Management, 18(9), 528. https://doi.org/10.3390/jrfm18090528
- Datosmacro.com. (2024). Gross domestic product of Spain. Retrieved March 24, 2025, from https://www.datosmacro.com/pib/espana
- De la Fuente, A. (Coord.), Ayuso, M., Conde-Ruiz, J. I., Devesa, E., Díaz-Giménez, J., Díaz-Saavedra, J., Doménech, R., Domínguez Fabián, I., Fuster, L., García Díaz, M. A., Herce, J. A., Jiménez, S., Marín Vigueras, J. M., Patxot, C., Sánchez Martín, A., & Serrano, F. (2023). Notas sobre las proyecciones de gasto en pensiones del MISSMI (Informes y papeles del Grupo de Trabajo Mixto Covid-19; Estudios sobre la Economía Española No. 2023-31). FEDEA.
- Díaz-Giménez, J., & Díaz-Saavedra, J. (2026). Pensions in Spain: A reform that backfires. International Tax and Public Finance, 33, 668–704. https://doi.org/10.1007/s10797-025- 09914-8
- Dirección General de Seguros y Fondos de Pensiones (DGSFP). (2016). Publicidad bases técnicas JCSFP: Tablas de mortalidad PEIB2014. https://dgsfp.mineco.gob.es/
- Duran, X., Vanroelend, C., Deboosere, P., & Benavides, F. G. (2016). Social security status and mortality in Belgian and Spanish male workers. Gaceta Sanitaria, 30(4), 293– 295.
- European Commission. (2024). The 2024 Ageing Report: Economic and budgetary projections for the EU Member States (2022–2070) – Country fiche: Italy. Directorate-General for Economic and Financial Affairs. https://economyfinance.ec.europa.eu/system/files/2024-01/italy_en.pdf
- Eurostat. (2020). Technical compilation guide for pension data in national accounts (2020 ed.). https://ec.europa.eu/eurostat/web/products-manuals-and-guidelines/-/ks-gq-20-008
- García-Díaz, M. A. (2023). La reforma de sistema público de pensiones 2022 y 2023: Contenido y posibles efectos (Estudios sobre la Economía Española 2023/08). FEDEA.
- Garvey, A. M., Pérez-Salamero González, J. M., Ventura-Marco, M., & Vidal-Meliá, C. (2023). Transforming the supplementary table on pension liabilities (Table 29) into an actuarial balance sheet. Public Money & Management, 43(8), 783–792. https://doi.org/10.1080/09540962.2022.2144362
- Geroldi, G., Brambilla, A., Camilleri, M., Prauscello, A., & Salvatore, G. (2025). The Italian pension system (Report No. 12). Research and Study Centre Itinerari Previdenziali.
- Groenewoud, B., & Ponds, E. (2025). Longevity gains and the internal rate of return of PAYG pension plans: Evidence for 17 OECD countries. The Journal of the Economics of Ageing, 100, 100567. https://doi.org/10.1016/j.jeoa.2025.100567
- Gronchi, S., Nisticò, S., & Bevilacqua, M. (2023). Increasing longevity, NDC implementation in Italy and Sweden, and all that. European Journal of Social Security, 25(3), 261–287. https://doi.org/10.1177/13882627231176537
- Haan, P., Kemptner, D., & Lüthen, H. (2020). The rising longevity gap by lifetime earnings: Distributional implications for the pension system. The Journal of the Economics of Ageing, 17, 100199. https://doi.org/10.1016/j.jeoa.2019.100199
- Hall, M., & Daly, L. (2016). Modelling the reverse select and ultimate mortality experience of UK ill-health retirement occupational pension scheme members. Annals of Actuarial Science, 10(2), 222–235. https://doi.org/10.1017/S1748499516000063
- Hernæs, E., Markussen, S., Piggott, J., & Røed, K. (2024). The impact of pension reform on employment, retirement, and disability insurance claims. Journal of Population Economics, 37, Article 76. https://doi.org/10.1007/s00148-024-01052-5
- Holzmann, R. (2017). The ABCs of nonfinancial defined contribution (NDC) schemes. International Social Security Review, 70, 53–77. https://doi.org/10.1111/issr.12142
- Istituto Nazionale della Previdenza Sociale (INPS). (2025a, April 23). Coefficiente di trasformazione. Retrieved May 25, 2026, from https://www.inps.it/it/it/dettaglioapprofondimento.schede-informative.49950.coefficiente-di-trasformazione.html
- Istituto Nazionale della Previdenza Sociale (INPS). (2025b, June 23). Pensione ai superstiti indiretta e di reversibilità. Retrieved May 25, 2026, from https://www.inps.it/it/it/dettaglio-scheda.it.schede-servizio-strumento.schedeservizi.pensione-ai-superstiti-indiretta-e-di-reversibilit--50605.pensione-ai-superstitiindiretta-e-di-reversibilit-.html
- Maleh, J., & Bosley, T. (2024). Disability and death probability tables for insured workers who attain age 20 in 2024 (Actuarial Note No. 2024.6). Social Security Administration, Office of the Chief Actuary. https://www.ssa.gov
- Mazzaferro, C. (2023). The transition to NDC in Italy: Assessing distributive and financial effects. Journal of Pension Economics & Finance, 22(1), 116–131. https://doi.org/10.1017/S1474747221000329
- Ministerio de Inclusión, Seguridad Social y Migraciones (MISSM). (2024). Muestra Continua de Vidas Laborales: Guía del contenido (Edición noviembre 2024). https://www.seg-social.es
- Ministero del Lavoro e delle Politiche Sociali (MLPS). (2025, October 28). Tasso annuo di capitalizzazione per la rivalutazione dei montanti contributivi: anno 2025. Retrieved May 25, 2026, from https://www.lavoro.gov.it/notizie/pagine/tasso-annuo-dicapitalizzazione-rivalutazione-montanti-contributivi-2025
- Morikawa, M. (2022). Uncertainty in long-term macroeconomic forecasts: Ex post evaluation of forecasts by economics researchers. The Quarterly Review of Economics and Finance, 85, 8–15. https://doi.org/10.1016/j.qref.2020.10.017
- O’Brien, L., & Zaranko, B. (2023, April 3). A reduced discount rate for public sector pensions will add billions to employer costs [Comment]. Institute for Fiscal Studies. https://ifs.org.uk/articles/reduced-discount-rate-public-sector-pensions-will-addbillions-employer-costs
- Pérez-Salamero González, J. M., Regúlez-Castillo, M., & Vidal-Meliá, C. (2017). The Continuous Sample of Working Lives: Improving its representativeness. SERIEs, 8(1), 43–95. https://doi.org/10.1007/s13209-017-0154-0
- Pitacco, E. (2019). Heterogeneity in mortality: A survey with an actuarial focus. European Actuarial Journal, 9(1), 3–30. https://doi.org/10.1007/s13385-019-00207-z
- Real Decreto Legislativo 8/2015, de 30 de octubre, por el que se aprueba el texto refundido de la Ley General de la Seguridad Social. Boletín Oficial del Estado, núm. 261, de 31 de octubre de 2015. https://www.boe.es/buscar/act.php?id=BOE-A-2015-11724
- Rose, K., Burkhalter, K., & Nickerson, D. (2024a). Internal real rates of return under the OASDI program for hypothetical workers (Actuarial Note No. 2024.5). Social Security Administration, Office of the Chief Actuary.
- Rose, K., Burkhalter, K., & Nickerson, D. (2024b). Money’s worth ratios under the OASDI program for hypothetical workers (Actuarial Note No. 2024.7). Social Security Administration, Office of the Chief Actuary.
- Sánchez-Romero, M., Lee, R., & Fürnkranz-Prskawetz, A. (2020). Redistributive effects of different pension systems when longevity varies by socioeconomic status. The Journal of the Economics of Ageing, 17, 100259. https://doi.org/10.1016/j.jeoa.2020.100259
- Seguridad Social. (2025). Tablas de mortalidad por tipos de pensión. Ministerio de Inclusión, Seguridad Social y Migraciones. https://www.segsocial.es/wps/portal/wss/internet/EstadisticasPresupuestosEstudios/Estadisticas/bdfeec0 3-24e9-46eb-92d8-91da80ece81a
- Serra-Saurina, L., Ubalde-López, M., & Benavides, F. G. (2021). Incapacidad permanente y mortalidad prematura en una cohorte de afiliados a la Seguridad Social en España,
- Swedish Pensions Agency (TSPS). (2023). Orange report 2022 (O. Settergren, Ed.). Pensionsmyndigheten. www.pensionsmyndigheten.se
- Ventura-Marco, M., & Vidal-Meliá, C. (2016). Integrating retirement and permanent disability in NDC pension schemes. Applied Economics, 48(12), 1081– 1102. https://doi.org/10.1080/00036846.2015.1093084
- Vidal-Meliá, C., Regúlez Castillo, M., & Pérez-Salamero González, J. M. (2025). Income inequalities in longevity among Spanish retirement pensioners aged 65+: A comprehensive analysis from 2008 to 2021. International Social Security Review, 78(4). 53-78 https://doi.org/10.1111/issr.70014
- Villanueva-García, J., Moral-Arce, I., & García Villalba, L. J. (2025). A microsimulation model for sustainability and detailed adequacy analysis of the retirement pension system. Mathematics, 13, 443. https://doi.org/10.3390/math13030443
Appendix A: Formal Valuation Framework
This appendix reports the formal equations used to reconstruct the NDC benchmark, value observed Spanish DB pension entitlements, incorporate survivor reversibility and compute the actuarial indicators used in the empirical analysis.
A.1. NDC Retirement Pension
The initial retirement benefit for an individual who retires at the ordinary retirement age at time � after contributing since entering the labor market , is calculated as follows:
\[P _ {(r, b)} ^ {R} = K _ {(r, b, \overline {{G d p}} _ {h})} ^ {R} \cdot T _ {(r, b)} ^ {r}\tag{A1}\]
Where: is the accumulated notional capital at retirement, calculated by capitalizing each monthly contribution based on the accredited contribution rate individual contribution base , and monthly-equivalent GDP growth rates . Specifically:
\[K _ {(r, b, \overline {{G d p}} _ {h})} ^ {R} = \sum_ {s = 1} ^ {A \cdot 1 2} y _ {\left(x _ {e} + \frac {s}{1 2}, b - A + \frac {s}{1 2}\right)} \cdot \theta_ {(x _ {e} + \frac {s}{1 2})} \cdot \prod_ {m = s + 1} ^ {A \cdot 1 2} \left(1 + \overline {{G d p}} _ {h (m)}\right) ^ {1 / 1 2}\tag{A2}\]
is the conversion coefficient transforming accumulated capital into a lifetime annuity. The annuity divisor incorporates gender- and contingency-specific mortality tables.
A.2. NDC Disability Pension
For an individual who develops a disability at age at time � after contributing since , the equivalent disability pension is computed as:
\[P _ {(d, b)} ^ {D} = K _ {(d, b, \overline {{G d p}} _ {h})} ^ {D} \cdot T _ {(d, b)} ^ {k}\tag{A3}\]
Where: is the accumulated notional capital at the onset of the disability. is the disability-pension–specific conversion coefficient.
(the disability annuity divisor) explicitly accounts for disability severity and hence lower life expectancy relative to the general population.
As noted in Section 2.4.1, this specification differs from the Italian disability formula in that it credits no fictitious contributions after onset and uses disability-specific divisors.
A.3. Capital Cost of Spanish DB Pensions
The actuarial capital cost of a Spanish DB pension is the present value of the expected pension stream recorded in the MCVL. For a pension with 14 annual payments1 (twelve monthly payments plus two additional payments) the capital cost is calculated as:
1 When benefits result from a work-related injury or an occupational disease, they are distributed in 12 payments, as the additional payments are prorated into the regular monthly payments.
\[C c _ {(x, b, i)} ^ {(j, g)} = P s _ {(x, b)} ^ {(j, g)} \cdot \left[ \binom{\delta a _ {(x, b, i (1 2))} ^ {j, g}}{} + \binom{\delta a _ {(x, b, i (2))} ^ {j, g}}{} \right]\tag{A4}\]
is the capital cost for an individual aged , of gender g with contingency � (disability or retirement) to be provisioned in year �.
is the initial monthly pension amount, according to MCVL records for year b.
is the present value of a unitary life annuity for a person aged of gender , commencing in year �, paid m times per year for monthly; for the two extra payments), growing annually at rate , and assessed with a mortality table aligned to the individual’s characteristics plus a discount factor with technical rate of interest �.
A.4. Survivor Reversibility
For pensions with survivor benefits, the contingent survivor annuity’s simplified calculation is:
\[{ } ^ { \delta } a _ { ( x / y , b , i ( m ) ) } ^ { j , g } = { } ^ { \delta } a _ { ( x , b , i ( m ) ) } ^ { j , g } + \gamma _ { w } \cdot ( { } ^ { \delta } a _ { ( y , b , i ( m ) ) } ^ { j , g * } - { } ^ { \delta } a _ { ( x y , b , i ( m ) ) } ^ { j , g } )\tag{A5}\]
Where is the proportion of the benefit transferred to surviving partner upon death of primary beneficiary; is the present value of the annuity for the surviving partner individually, and is the present value of an annuity payable only while both partners remain alive.
A.5. Actuarial Indicators
The notional-cost gap is defined as NDC capital minus the actuarial cost of the observed DB pension:
\[\Delta \mathrm{K} _ {\mathrm{(x,t)}} ^ {\mathrm{(j,g)}} = \mathrm{K} _ {\left(\mathrm{x,t}, \overline {{\mathrm{Gdp}}} _ {\mathrm{h}}\right)} ^ {\mathrm{(j,g)}} - C c _ {\mathrm{(x,t,i)}} ^ {\mathrm{(j,g)}}\tag{A6}\]
The money’s-worth ratio is defined as the ratio between DB capital cost and reconstructed NDC capital:
\[M W R _ {(x, t)} ^ {(j, g)} = \frac {C c _ {(x , t , i)} ^ {(j , g)}}{K _ {(x , t , \overline {{G d p}} _ {h})} ^ {(j , g)}}\tag{A7}\]
The real internal rate of return is defined as the discount rate that equalizes accumulated NDC capital with the present value of expected DB pension payments:
\[K _ {(x, t, \overline {{G d p}} _ {h})} ^ {(j, g)} = P s _ {(x, b)} ^ {(j, g)} \cdot \left[ \left(^ {\delta} a _ {(x, b, i r r (1 2))} ^ {j, g}\right) + \cdot \left(^ {\delta} a _ {(x, b, i r r (2))} ^ {j, g}\right) \right]\tag{A8}\]
Where is the accumulated notional capital indexed by average nominal GDP growth; is the initial monthly DB pension, and is the present value of a unitary life annuity paid � times per year, growing annually at rate , discounted at IRR, and adjusted for mortality specific to individual demographics and pension contingency.
Appendix B: Disability-Specific Mortality Assumptions
Individuals with disabilities experience higher mortality than the general population, with life expectancy varying according to disability cause, severity and permanence (Pitacco, 2019). Actuarial research has emphasized the need to adjust mortality assumptions for individuals with disabilities when valuing social security benefits (Maleh & Bosley, 2024).
Following Hall and Daly (2016), we incorporate an extra-mortality component into standard mortality tables. The adjustment allows excess mortality to be highest at disability onset and to decline gradually with duration, reflecting the reverse-selection pattern commonly observed among ill-health and disability pensioners.
For an individual with a disability, the mortality risk is adjusted to account for the severity of disability and the duration since disability onset. We introduce the following notation:
The observed mortality rate at age � during period � for the general population.
: The calendar year when disability occurs.
The age at which the individual develops a disability.
The duration (in years) since disability inception.
: The disability severity grade, where � = 1 represents the least severe and the most severe case.
The adjusted one-year mortality probability is defined as:
\[q _ {x, t} ^ {(k, g)} (x _ {0}) = M _ {k, g} (t - t _ {0}) \cdot q _ {x, t}\tag{B1}\]
where the mortality multiplier is given by:
\[M _ {(k, g)} (t - t _ {0}) = 1 + (\bar {A} (k, g) - 1) \cdot e ^ {- \delta (k, g) (t - t _ {0})}\tag{B2}\]
Here, represents the initial excess-mortality factor associated with disability severity grade � and gender , while governs the speed at which the excessmortality component declines with duration since disability onset.
For Spain, and are calibrated to reflect the persistent mortality disadvantage documented among individuals with disabilities (Duran et al., 2016; Serra-Saurina et al., 2021). The initial factor is set above unity and increases with severity, while the decay parameter is chosen to produce a gradual reduction in excess mortality over time. The parameter values used in the valuation are reported in Table B1.
Note: represents the relative increase in mortality at disability onset. governs the speed at which excess mortality decreases over time.
| Table B1: Excess mortality factors and decay rates by gender for Spain | ||||
| Severity grade (k) | $\overline{A}(k,g)$ | $\delta(k,g)$ | ||
| Males | Females | Males | Females | |
| 1 (Total) | 1.5 | 1.4 | 0.04 | 0.05 |
| 2 (Absolute) | 2.2 | 1.9 | 0.03 | 0.04 |
| 3 (Great Invalidity) | 3 | 2.6 | 0.02 | 0.03 |
The adjusted mortality probabilities are then used to construct disability-specific survival profiles and corresponding life expectancy estimates. Table B2 reports the resulting life expectancy estimates for individuals with disabilities, differentiated by severity level age at disability onset x₀, gender and attained age. These estimates are compared with general Spanish population life expectancy, denoted by INEF for females and INEM for males.
The values in Table B2 show three relevant actuarial patterns. First, life expectancy declines systematically with disability severity: for a given sex, onset age and attained age, grade 3 always produces the lowest remaining lifetime. Second, the age at which disability occurs affects the resulting survival profile, so disability mortality cannot be represented only by attained age. Third, the mortality penalty is especially visible among males and among individuals classified in the most severe disability category. These differences are material for pension valuation because they directly determine the expected duration of disability benefit payments and, therefore, the comparison between DB pension liabilities and the NDC counterfactual.
Table B2: Life expectancy for individuals with disabilities, degree of severity (�) and the age at which the individual develops a disability (2016-2021)
| $x_0$ | 35 | 45 | 55 | |||||||
| k | 1 | 2 | 3 | 1 | 2 | 3 | 1 | 2 | 3 | |
| Age | FEMALES | INEF | ||||||||
| 35 | 51.18 | 50.11 | 48.03 | 51.73 | ||||||
| 45 | 41.48 | 40.50 | 38.54 | 41.18 | 39.83 | 37.53 | 41.96 | |||
| 55 | 32.11 | 31.26 | 29.51 | 31.86 | 30.70 | 28.64 | 31.47 | 29.91 | 27.57 | 32.49 |
| 65 | 23.17 | 22.51 | 21.05 | 22.99 | 22.07 | 20.36 | 22.71 | 21.46 | 19.51 | 23.46 |
| Age | MALES | INEM | ||||||||
| 35 | 45.21 | 42.73 | 39.24 | 46.48 | ||||||
| 45 | 35.70 | 33.40 | 29.97 | 35.17 | 32.38 | 29.00 | 36.84 | |||
| 55 | 26.77 | 24.77 | 21.70 | 26.34 | 23.91 | 20.86 | 26.17 | 23.61 | 20.57 | 27.71 |
| 65 | 18.82 | 17.27 | 14.77 | 18.50 | 16.62 | 14.13 | 18.05 | 16.39 | 13.91 | 19.49 |
| Source: Own elaboration | ||||||||||
Until recently, the PEIB2014 tables were the main reference for disability mortality in Spain, but their applicability to pension valuation is limited. They do not differentiate by disability onset age or gender and rely partly on outdated or foreign mortality sources (DGSFP, 2016). More recent Social Security mortality tables by benefit type represent progress, but still fail to fully capture the relevant heterogeneity (Seguridad Social, 2025). For this reason, we construct tailored mortality tables that incorporate disability onset age, gender, severity level and updated survival patterns, allowing a more precise valuation of disability-pension obligations within the DB–NDC benchmarking framework.
Appendix C: The Italian NDC Reference Case
This appendix summarizes the Italian NDC framework used in the paper as an institutional reference case. The objective is not to replicate the Italian system, but to show how disability and survivor benefits require additional actuarial and legal design choices even within a contribution-based NDC architecture.
To remain consistent with Appendix A, notional capital is expressed at monthly frequency. Let denote the age of entry into the labour market, � the age at which the relevant contingency occurs, and � the year in which the benefit is awarded. For the contingency is old-age retirement; for , it is disability onset.
\[K _ {(z \cdot b \cdot G \bar {d} p _ {h} ^ {I T})} ^ {I T, j} = \sum_ {S = 1} ^ {N _ {z}} y _ {(x _ {e} + s / 1 2, b - N _ {z} / 1 2 + s / 1 2)} ^ {I T} \cdot \theta_ {(x _ {e} + s / 1 2)} ^ {I T} \prod_ {m = s + 1} ^ {N _ {z}} \left(1 + G \bar {d} p _ {h (m)} ^ {I T}\right) ^ {1 / 1 2}\tag{C1}\]
where is the number of monthly contribution records accumulated up to the relevant event, is the monthly contribution base, is the credited contribution rate and is the Italian notional revaluation rate applied to month �, expressed as a monthly-equivalent rate. In the Italian contributory system, this rate is linked to the compound average growth rate of nominal GDP over the preceding five years, as established under Article 1, paragraph 9, of Law No. 335/1995 (Ministero del Lavoro e delle Politiche Sociali, 2025).
C.1. Old-age pension under the Italian NDC rule
The annual old-age pension is obtained by multiplying accumulated notional capital by the transformation coefficient corresponding to the age at pension commencement:
\[P _ {(r, b)} ^ {I T, R} = K _ {(r, b, G \bar {d} p _ {h} ^ {I T})} ^ {I T, R} \cdot T _ {(r, b)} ^ {I T}\tag{C2}\]
where . Italian transformation coefficients are age-specific and embed both the expected value of the contributor’s own pension and a survivor-related component. For the purposes of this paper, the relevant point is that survivor entitlements are incorporated into common transformation parameters rather than valued through an individualized survivor-contingent annuity factor.
This differs from the benchmark developed in the main text, where survivor reversibility is valued explicitly by comparing single-life and survivor-contingent DB liabilities.
C.2. Disability pension under the Italian NDC rule
The Italian disability scheme is relevant because benefits are integrated within the NDC architecture but are not based on a strictly contribution-based rule. For an individual who becomes disabled at age � in year �, the disability pension may be represented as:
\[P _ {(d, b)} ^ {I T, D} = \left[ K _ {(d, b, G \bar {d} p _ {h} ^ {I T})} ^ {I T, D} + B _ {(d, b)} ^ {I T, D} \right] \cdot T _ {(\max (d, 5 7), b)} ^ {I T}\tag{C3}\]
where is obtained from equation (C1) up to disability onset, is the conventional contributory bonus credited because of disability, and is the transformation coefficient applied to the benefit. When the pension is awarded before age 57, the transformation coefficient corresponding to age 57 is applied (INPS, 2025a).
The conventional bonus can be summarized as:
\[B _ {(d, b)} ^ {I T, D} = 1 2 \cdot L _ {(d)} \cdot \bar {y} _ {(d, b)} ^ {I T} \cdot \theta^ {I T}\tag{C4}\]
where is the adjusted average monthly contribution base over the five years preceding disability onset and is the additional credited contribution period, subject to the statutory maximum contributory ceiling.
This is the key difference with the benchmark used in this paper. In the Italian formula, disability pension wealth may be increased by a conventional contributory bonus. In our counterfactual, notional capital is estimated only from observed contribution records. Moreover, the Italian transformation coefficient is not differentiated by disability severity or disability-specific mortality, whereas our benchmark uses disability-specific annuity divisors reflecting severity, sex and age at disability onset.
C.3. Survivor pensions in the Italian reference case
Italian survivor pensions are calculated as a percentage of the pension already awarded, or of the pension that would have been awarded, to the deceased insured person:
\[P _ {(h, b)} ^ {I T, S} = \alpha_ {h} \cdot P _ {(b)} ^ {I T, j}\tag{C5}\]
where is the survivor pension paid to household type ℎ, is the pension of the deceased insured person or pensioner under contingency �, and is the statutory survivor-benefit fraction.
In the cases most relevant for the comparison
Este texto se ha extraído automáticamente del documento original. Para citarlo o leerlo con su maquetación, descargue el PDF.
Descargar en PDF